Orange Pi 5用として公式で出ているAndroid 12とOrange Pi OS (Droid)のどちらにもGoogle Playは入っていなかった。
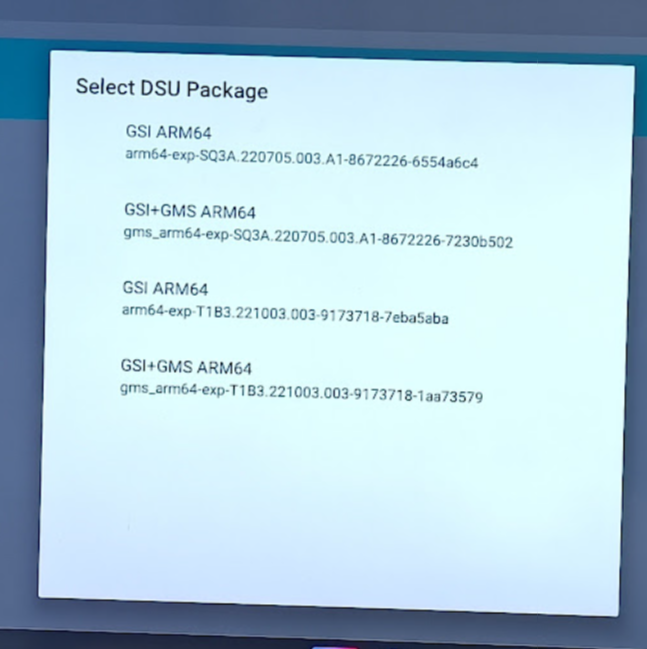
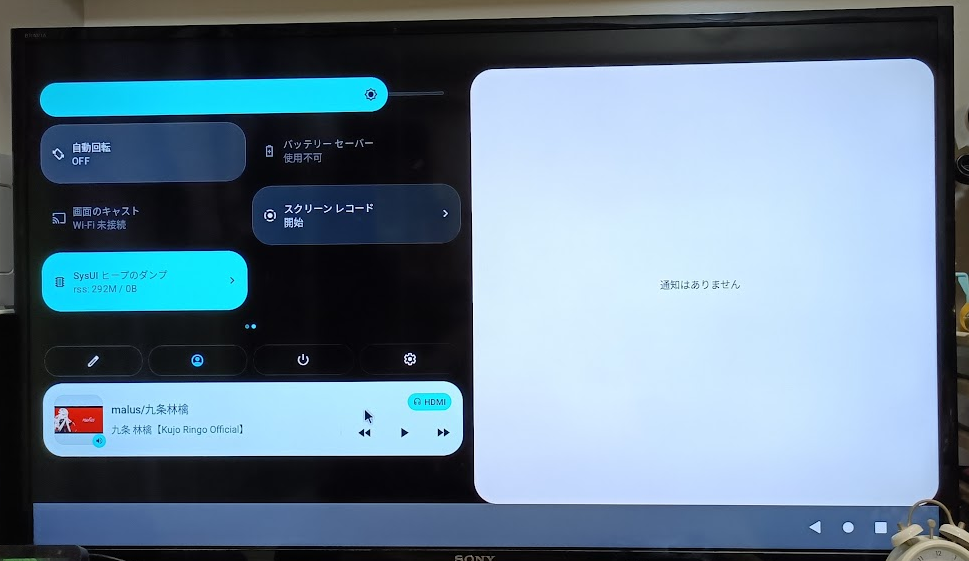
しかし、開発者向けオプションを有効にしてみると、DSU Loaderが使えることがわかった。
また、root権限が使える状態であるため、DSU Sideloader を使うと好きなGSI イメージを使って起動させることができそうです。
(注: LCD用Androidイメージ+Type-Cディスプレイの場合、GSIイメージで起動すると最初はHDMI出力のみで、初期セットアップ完了後じゃないとType-Cディスプレイが使えませんでした)
phhussonさんとこのGeneric System Image (GSI) List からAOSP 12.1 v416を使って見ました。
(なお、GSIイメージによっては黒画面のまま起動してきません)
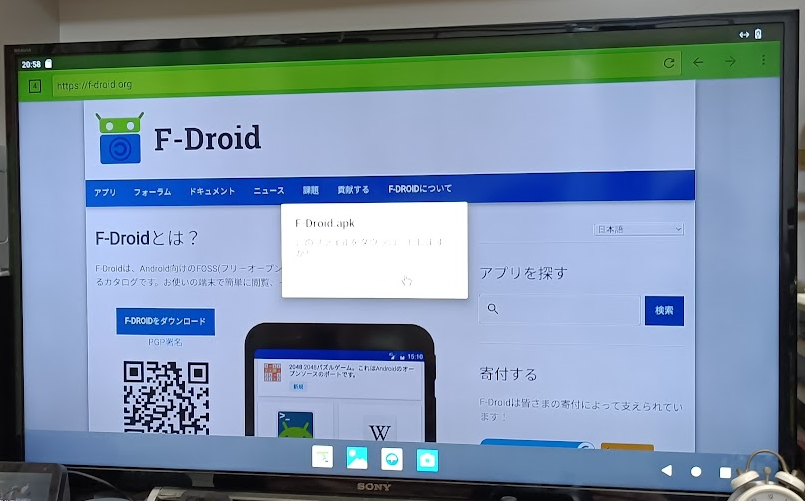
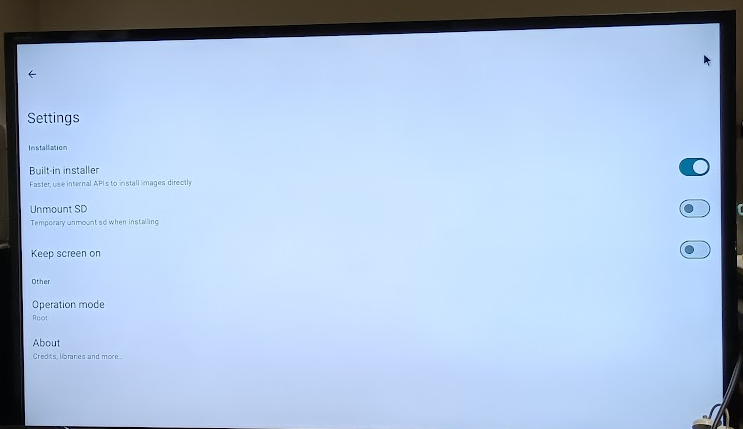
まず、起動したAndroid上の検索枠で「dsu loader github」と検索すると出てくるDSU Sideloaderのgithubページにある apkファイルをAndroidにインストールして、DSU Sideloaderアプリの設定で「Build-in installer」を有効にしてから、GSIイメージを選択してインストールします。
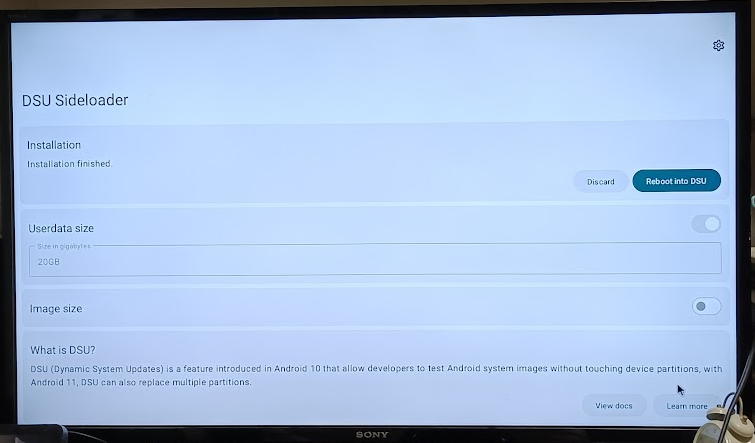
Userdate sizeを30GB以上に設定しないと原神はインストールできないと思います。(22GBだと駄目だったので、とりあえず50GBで設定した)
インストールに使用するGSIイメージは system-squeak-arm64-ab-gapps.img.xz を使いました。Androidブラウザでダウンロードするとファイル名が system-squeak-arm64-ab-gapps.bin で保存されてしまうので、保存完了後ファイル名を system-squeak-arm64-ab-gapps.img.xz に変更する必要があります。
正常に導入が終わると「Reboot into DSU」というボタンが現れるので、それをクリックすると、GSIイメージのAndroidが起動します。
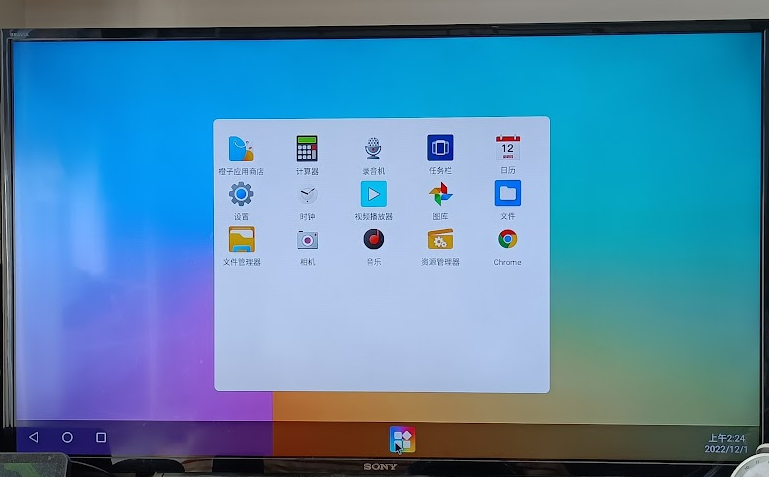
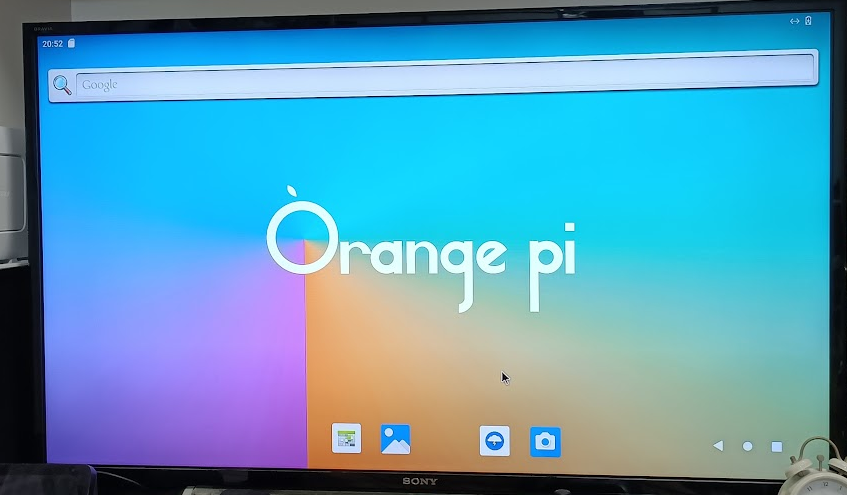
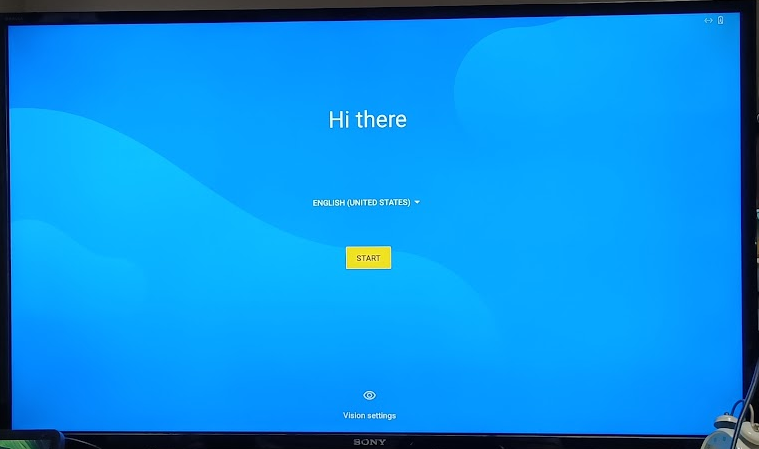
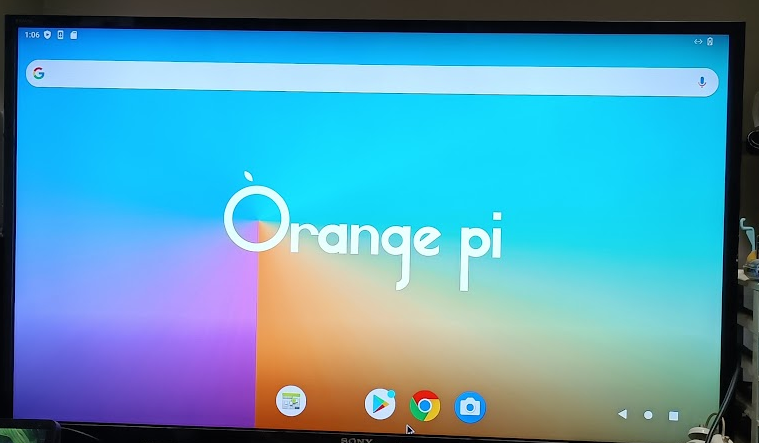
正常に動作するGSIイメージであればAndroidの初期画面が表示されるでしょう
Google Playストアがありますね
で・・・原神も動きました。
ただ、Orange Pi 5のAndroidだとHDMI/Type-Cディスプレイで音が出るんですが、GSIイメージから起動すると、Orange Pi 5オンボードのイヤフォン端子からのみ音が出る、という状態でした。
原神は、初期設定だとグラフィック設定:低いとちょっと荒い表示ですが、設定で「最高」を選んでも問題無く動きました。
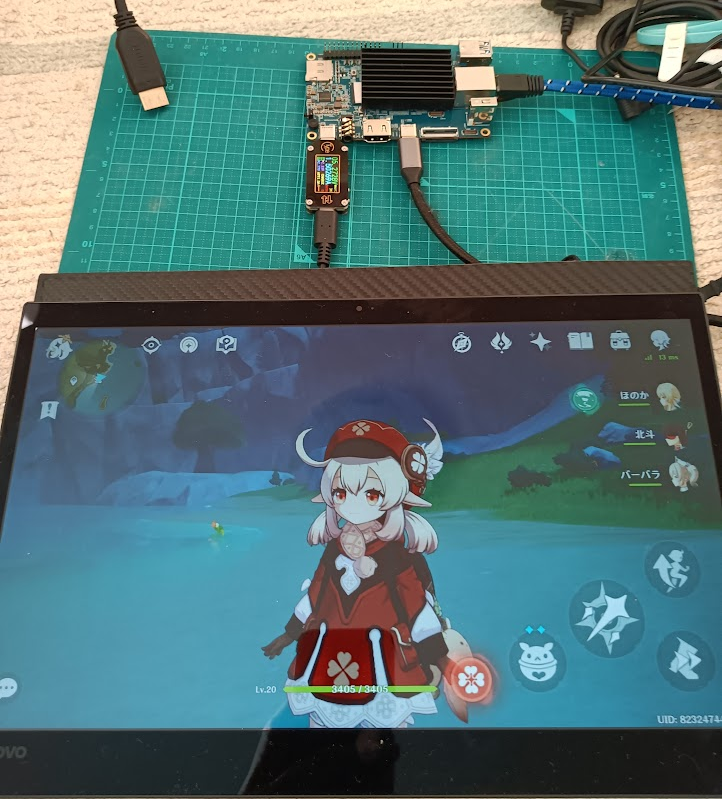
その際の消費電力は5V1.8Aぐらいを上限として1.1A~1.8Aを動いている感じでした。
Lenovo/ワコム液晶をType-Cコネクタ1本でつないだ場合の使い勝手について
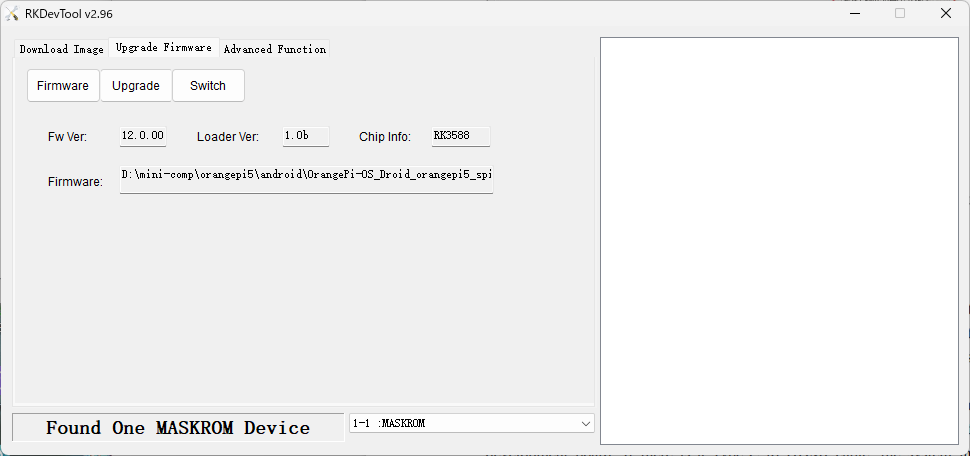
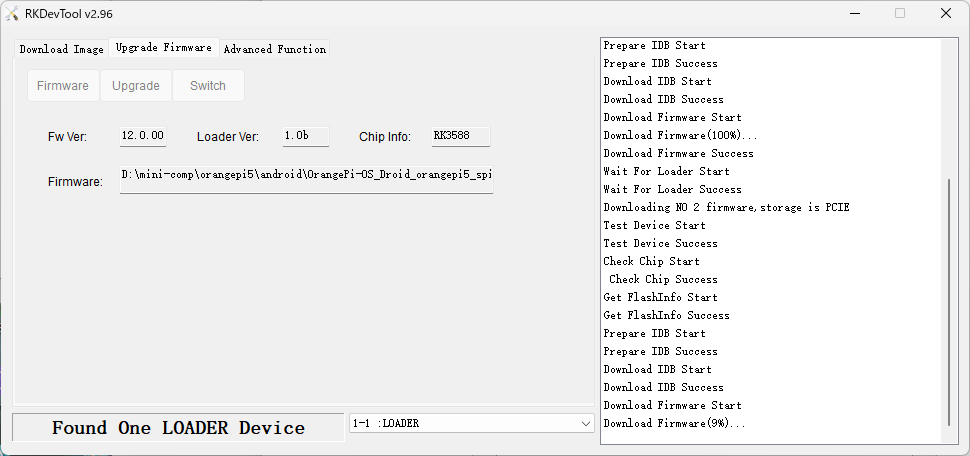
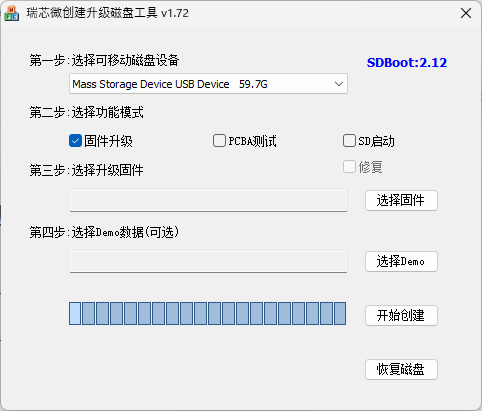
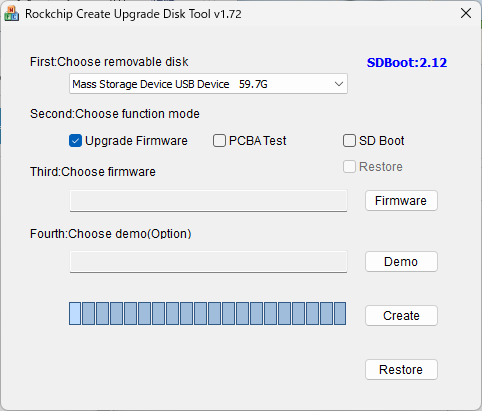
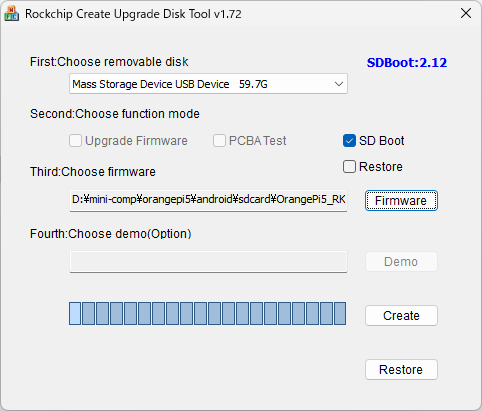
OrangePi5_RK3588S_Android12_spi-nvme_lcd_v1.0.0.img
→ いまいち。タッチ動作がおかしくなったり、GSIイメージで起動した場合のディスプレイ出力が怪しかったりする
なぜかGSIイメージで原神を起動するとすぐに落ちる
ブート画面はType-C側に出力される
OrangePi5_RK3588S_Android12_spi-nvme_v1.0.0.img
→ 問題無し? 液晶側から音もなるが、GSIイメージ起動の場合はOrange Pi本体のイヤフォン端子からのみ音が出る
GSIイメージで原神は問題無く動いた
ブート画面はHDMI側に出力され、Type-Cディスプレイしかつないでない場合、起動が完了するころまで黒画面のままとなる
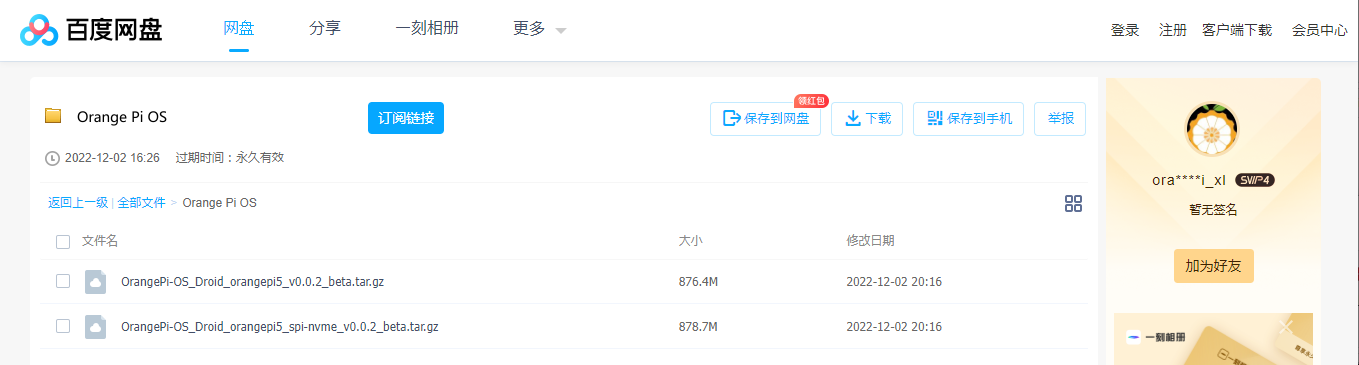
OrangePi-OS_Droid_orangepi5_spi-nvme_v0.0.2_beta.img
→ OrangePi5_RK3588S_Android12_spi-nvme_v1.0.0.imgとだいたい同じような感じ。
v0.0.3へのアップデートがふってくることと来ないことがあるのが謎
GSIイメージで原神は問題無く動いた
ブート画面はHDMI側に出力され、Type-Cディスプレイしかつないでない場合、起動が完了するころまで黒画面のままとなる