netapp9101dr::> snapmirror show-history -start-time "12/21/2022 15:05:00"

Destination Source                Start       End
Path        Path        Operation Time        Time        Result
----------- ----------- --------- ----------- ----------- -------
svmdr:vol_shares_dest svm0:shares scheduled-update 12/21/2022 15:05:00 12/21/2022 15:05:04 success

netapp9101dr::>
1秒でもずらすと表示されない
netapp9101dr::> snapmirror show-history -start-time "12/21/2022 15:05:01"
There are no entries matching your query.

netapp9101dr::> snapmirror show-history -start-time "12/21/2022 15:04:59"
There are no entries matching your query.

netapp9101dr::>
マニュアル記述をよく見てみると「Select SnapMirror operations that have a matching start time」とあり、一致したものという限定だった
日時を指定しないで実行出来るか試してみる・・・
netapp9101dr::> snapmirror show-history -start-time 12/21/2022

Error: "12/21/2022" is an invalid value for field "-start-time <"MM/DD/YYYY
       HH:MM:SS">"

netapp9101dr::>
?や*で指定はできるか、も試したが駄目だった
netapp9101dr::> snapmirror show-history -start-time 12/21/2022  ?

Error: "12/21/2022" is an invalid value for field "-start-time <"MM/DD/YYYY
       HH:MM:SS">"

netapp9101dr::> snapmirror show-history -start-time 12/21/2022 *:*:*
There are no entries matching your query.

netapp9101dr::>
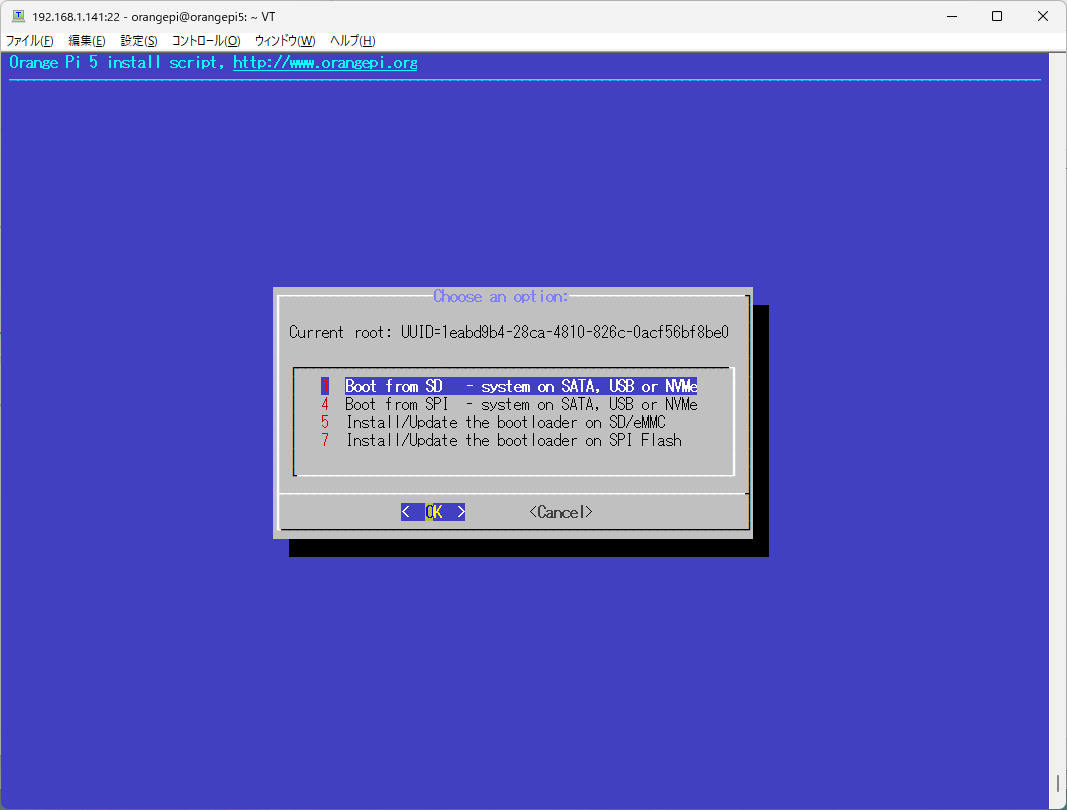
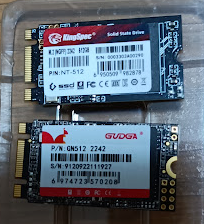
orangepi@orangepi5:~$ sudo dd if=Orangepi5_1.0.6_ubuntu_jammy_desktop_xfce_linux5.10.110.img of=/dev/nvme0n1 status=progress
6924734976 bytes (6.9 GB, 6.4 GiB) copied, 278 s, 24.9 MB/s
13533184+0 records in
13533184+0 records out
6928990208 bytes (6.9 GB, 6.5 GiB) copied, 279.176 s, 24.8 MB/s
orangepi@orangepi5:~$
現状のパーテーションを確認
orangepi@orangepi5:~$ sudo fdisk -l /dev/nvme0n1
GPT PMBR size mismatch (13533183 != 1000215215) will be corrected by write.
The backup GPT table is not on the end of the device.
Disk /dev/nvme0n1: 476.94 GiB, 512110190592 bytes, 1000215216 sectors
Disk model: NXM-512
Units: sectors of 1 * 512 = 512 bytes
Sector size (logical/physical): 512 bytes / 512 bytes
I/O size (minimum/optimal): 512 bytes / 512 bytes
Disklabel type: gpt
Disk identifier: 53AE4D8D-573C-E044-AB71-027F31F37494

Device          Start      End  Sectors  Size Type
/dev/nvme0n1p1  61440   585727   524288  256M Linux extended boot
/dev/nvme0n1p2 585728 13533150 12947423  6.2G Linux filesystem
orangepi@orangepi5:~$
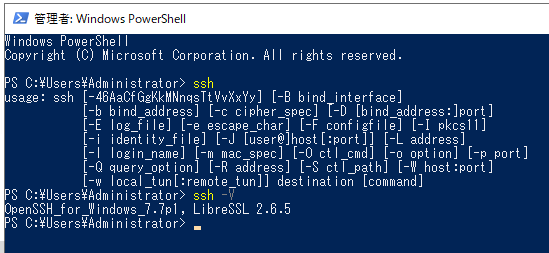
PS C:\Users\Administrator> ssh-keygen
Generating public/private rsa key pair.
Enter file in which to save the key (C:\Users\Administrator/.ssh/id_rsa):
Created directory 'C:\Users\Administrator/.ssh'.
Enter passphrase (empty for no passphrase):
Enter same passphrase again:
Your identification has been saved in C:\Users\Administrator/.ssh/id_rsa.
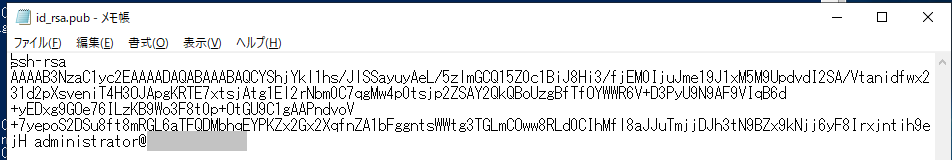
Your public key has been saved in C:\Users\Administrator/.ssh/id_rsa.pub.
The key fingerprint is:
SHA256:Eomw4OJ5tGv2Nx0HkGCeaRT5PxBU3krAixd96aCIkJU administrator@WindowsServer
The key's randomart image is:
+---[RSA 2048]----+
|. +..=*o+. . |
|.+ E+ooBoo.o |
|..o.o=* *o+. |
|o o.oo B.... |
| o o o S.. |
| . . . + . |
| + . + |
| o . o . |
| .. . |
+----[SHA256]-----+
PS C:\Users\Administrator>
netapp::> security login create -user admin -application ssh -authentication-method publickey -role admin
Warning: To use public-key authentication, you must create a public key for user "admin".

netapp::>
上記で警告が出ていますが、これは現状該当するユーザ用の公開鍵が登録されていないためのものです。
再度「security login show -vserver クラスタ名」を実行すると、publickeyの登録が増えていることが確認出来ます。
netapp::> security login show -vserver netapp

Vserver: netapp
                                                                 Second
User/Group                 Authentication                 Acct   Authentication
Name           Application Method        Role Name        Locked Method
-------------- ----------- ------------- ---------------- ------ --------------
admin          console     password      admin            no     none
admin          http        password      admin            no     none
admin          ontapi      password      admin            no     none
admin          service-processor
                           password      admin            no     none
admin          ssh         password      admin            no     none
admin          ssh         publickey     admin            -      none
autosupport    console     password      autosupport      no     none
7 entries were displayed.

netapp::>
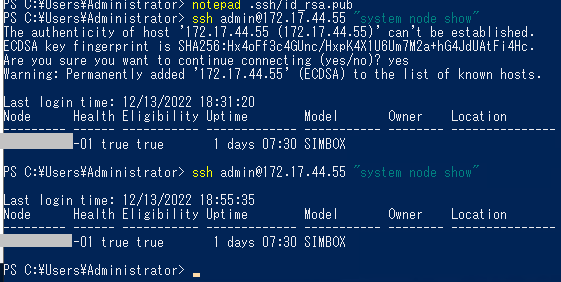
PS C:\Users\Administrator> ssh admin@172.17.44.55 "system node show"
The authenticity of host '172.17.44.55 (172.17.44.55)' can't be established.
ECDSA key fingerprint is SHA256:Hx4oFf3c4GUnc/HxpK4X1U6Um7M2a+hG4JdUAtFi4Hc.
Are you sure you want to continue connecting (yes/no)? yes
Warning: Permanently added '172.17.44.55' (ECDSA) to the list of known hosts.

Last login time: 12/13/2022 18:31:20
Node      Health Eligibility Uptime        Model       Owner    Location
--------- ------ ----------- ------------- ----------- -------- ---------------
netapp-01 true true       1 days 07:30 SIMBOX

PS C:\Users\Administrator> ssh admin@172.17.44.55 "system node show"

Last login time: 12/13/2022 18:55:35
Node      Health Eligibility Uptime        Model       Owner    Location
--------- ------ ----------- ------------- ----------- -------- ---------------
netapp-01 true true       1 days 07:30 SIMBOX

PS C:\Users\Administrator>
@echo off
ssh admin@172.17.44.55 "date" >> c:\tmp\command.txt
これをタスクスケジューラに登録してログアウト。
指定時間経過後にファイルを確認してみます。
PS C:\Users\Administrator> type C:\tmp\command.txt

Last login time: 12/13/2022 19:00:13

Node      Date                     Time zone
--------- ------------------------ -------------------------
netapp-01
          Tue Dec 13 19:05:11 2022 Japan

PS C:\Users\Administrator>