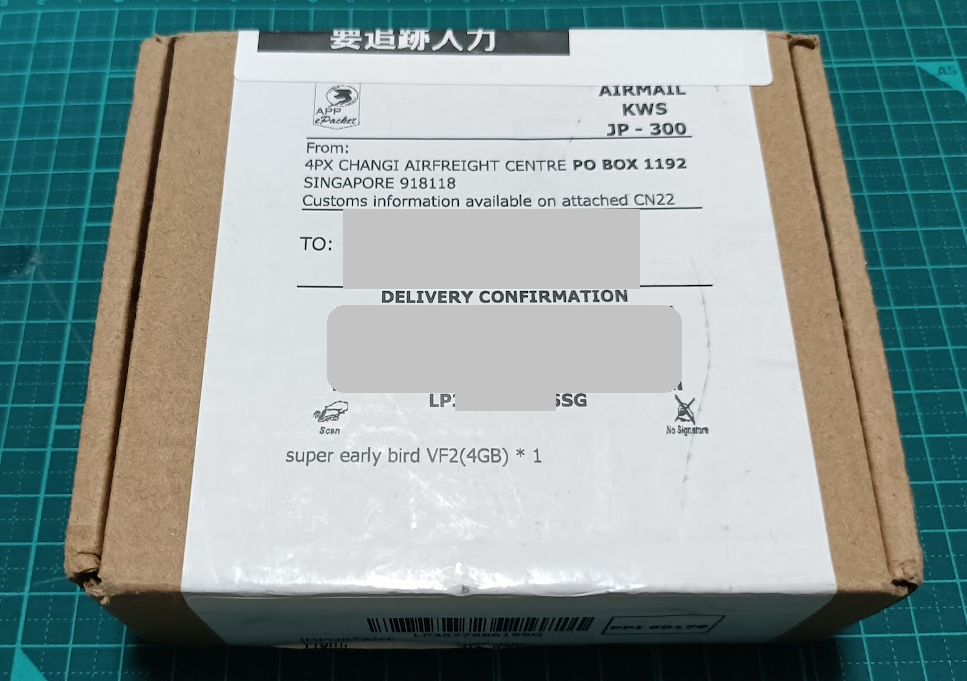
64bitのRISC-Vコアを4コア積んだSoC StarFive JH7110を使用したStarFive Vision Five2のクラウドファンディングが8月にあったのでRAM 4GBモデルを1個手配した。(ラズパイ4相当の性能が出るらしいRISC-VコアのSBC StarFive Vision Five 2のクラウドファンディングが進行中)
当初予定は2022年11月でしたが順調に遅れて、年越し間近の2022年12月29日に届きました。発送連絡は無く、突然の到着でした。
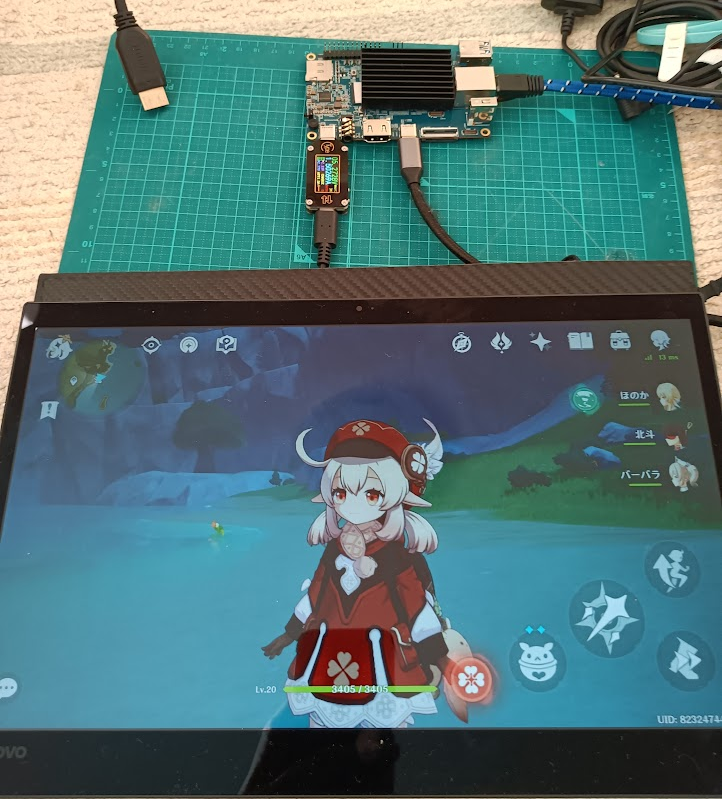
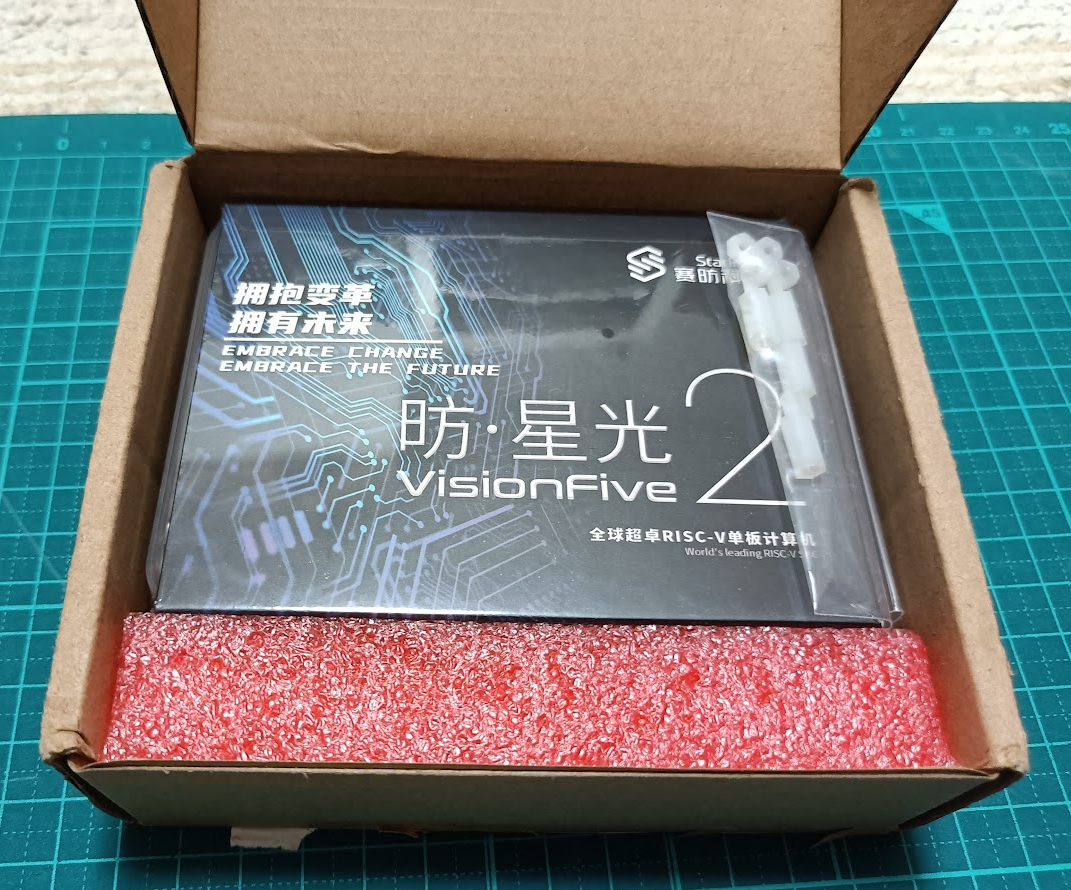
中はこんな感じ
中身のボードはこんな感じ
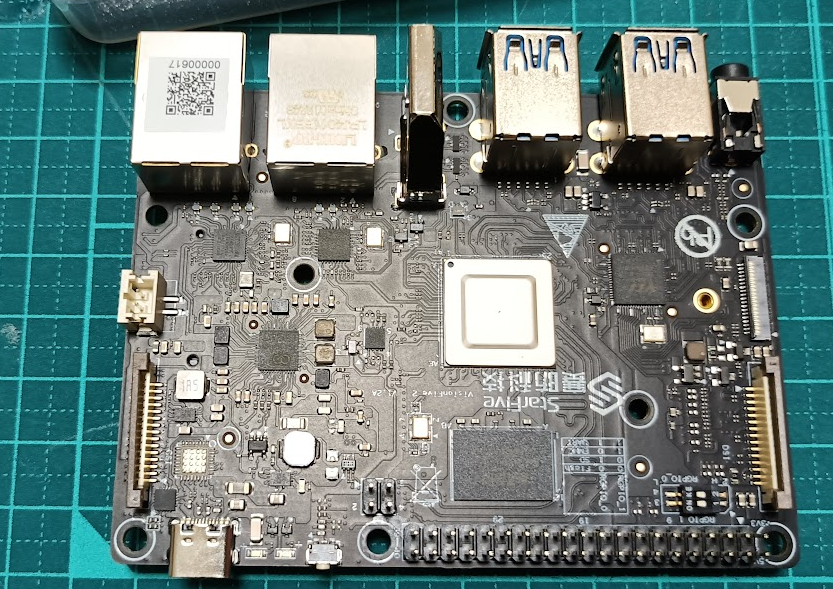
USBコネクタ 4個、HDMI、NIC 2ポートが同じ面についています。
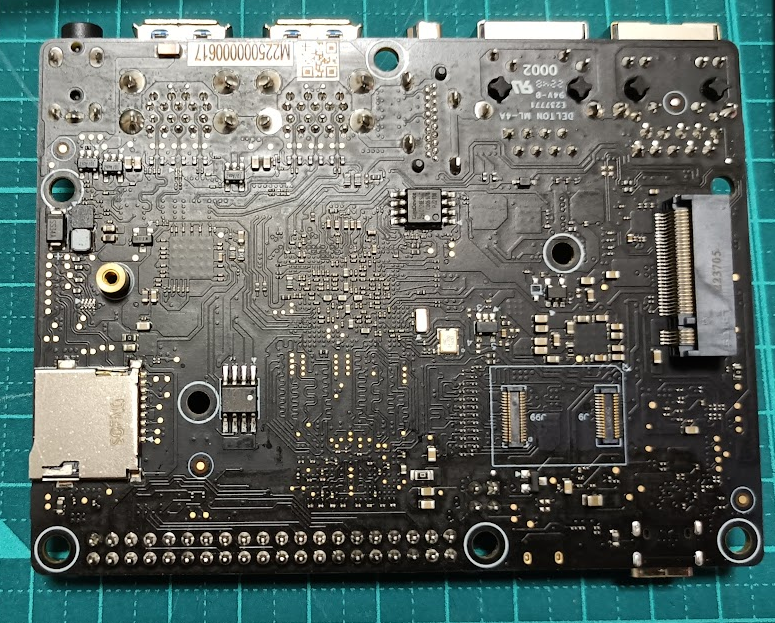
裏面は、M.2 M-keyとmicroSDスロットです。
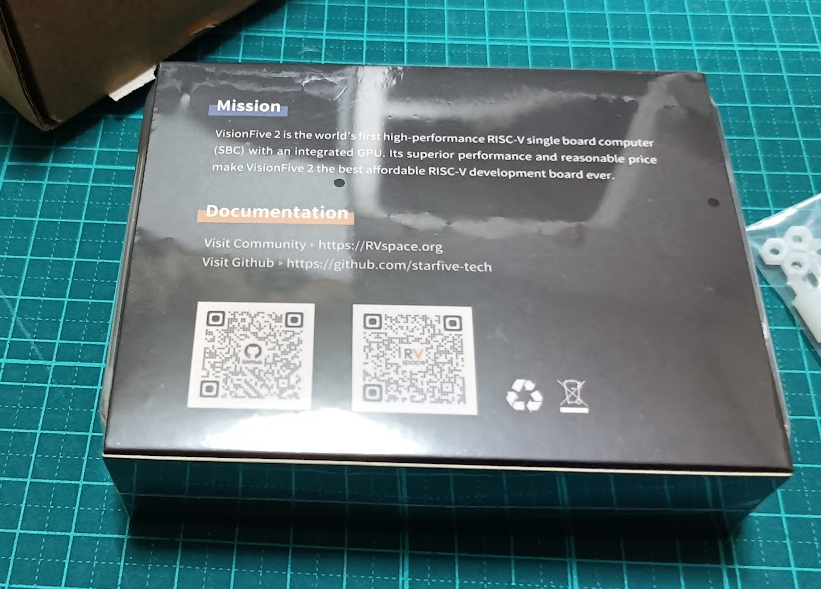
Vision Five 2に関するドキュメントは https://doc-en.rvspace.org/Doc_Center/visionfive_2.html にあります。
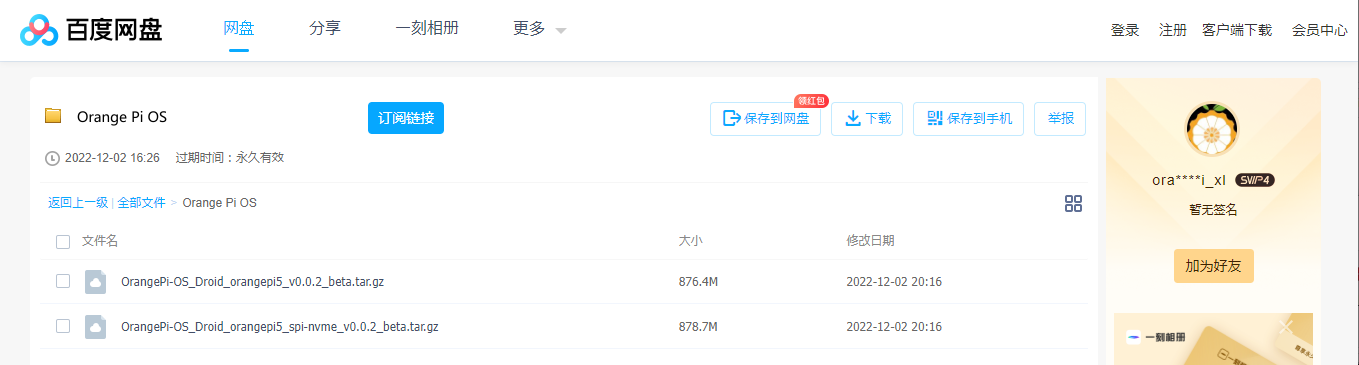
Debian OSの入手先は「Quick Start Guide」の「Flashing with Linux or Windows」に「Download the latest Debian image from: this link.」と記載されているように https://debian.starfivetech.com/ からダウンロードできます。
2022/12/30時点では2022/12/20付けのImage-55、2022/12/26付けのImage-69が入手できます。
Quick Start Guideの「Logging into Debian」を見ると、HDMI画面が普通に出てくるように読めますが、実際のところ、標準出力は、GPIO端子のUARTシリアルコンソールとなっています。
このため、Xが起動するまでHDMI出力は真っ暗なままです。
しかも、新しいImage-69の方はX画面が出ません。Image-55であればX画面が出ます。
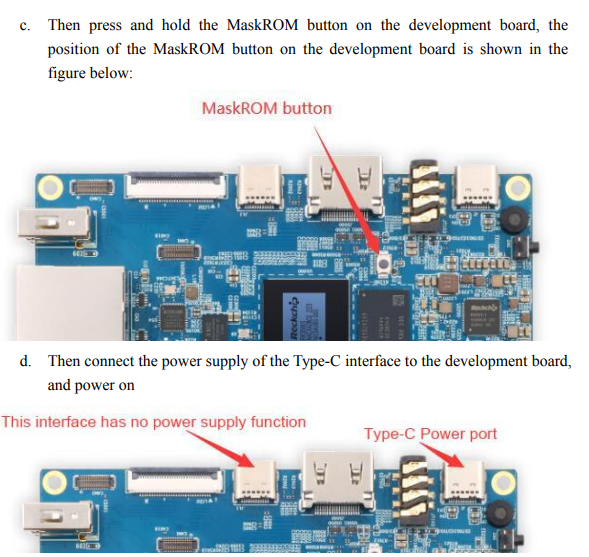
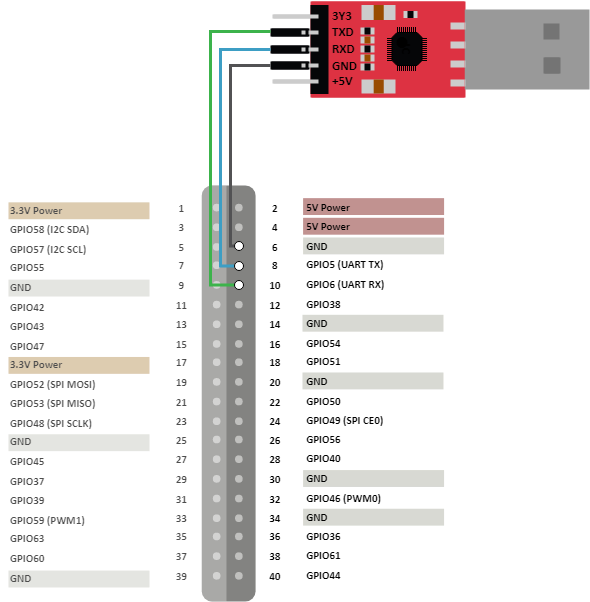
シリアルコンソールはUsing a USB to Serial Converter の For Windows にある下記にしたがって結線して、115200 で接続。
うちで転がっていた大昔のPlannex NAS開発キットについてたTTL変換を久々に利用している。
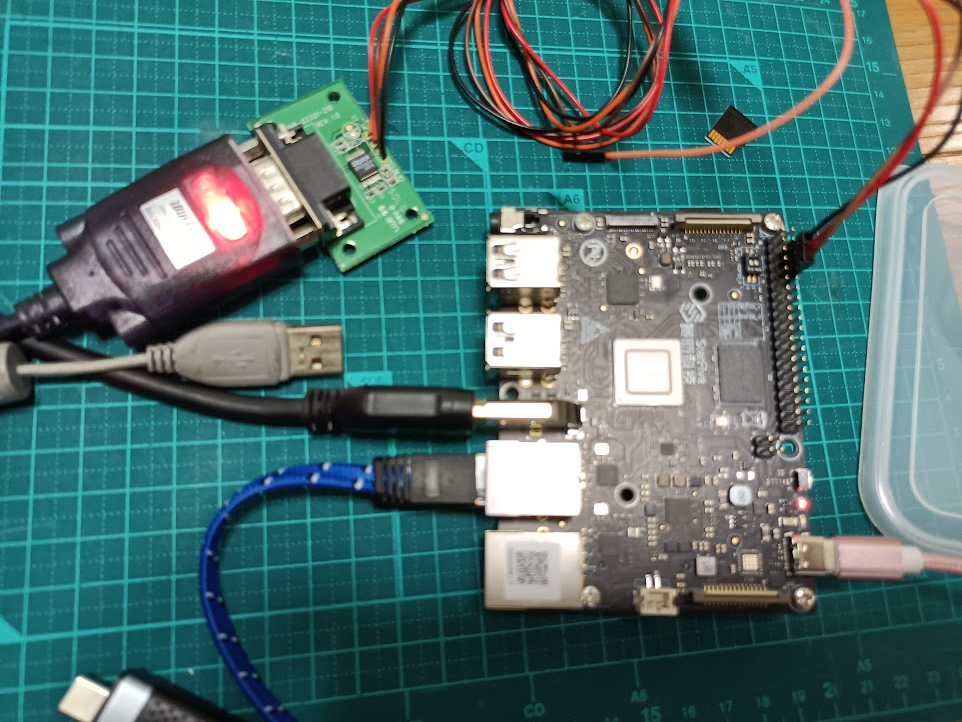
Image-69のイメージを書き込んだmicroSDで起動してみると・・・
U-Boot SPL 2021.10`(Oct 31 2022`- 12:11:37 +0800)
DDR version: dc2e84f0.
Trying to boot from SPI
OpenSBI v1.0
``・ ・$x慄韶鞐X萎X・・蝠・蝠・・H 厰 ・$<慙韶隶 戉・}}髫碯 鯏5R矜聰}燾濵・蝠 B炫 ・}モ驍5R矜矜浯z浯:浯碌 ・ ?浯矜5R矜}}驍磊モ炫 ・磊}}}モ磊モ驍}5R碯・・ r炫 ・・統驍}髱}}}}盾}}}}恕}}}}餤R`淫
酌 鞐_粟?典Rj・Platform Name `鞐靹挨筧MX坑ive VisionFive V2
Platform Features 玻雕`medeleg
・衣clint-mswiCount 鞐漂jだ?宿喫A%"?
Platform Timer Device > aclint-mtimer @ 400ppppHz
Platform Console Device : uart8250
Platform HSM Device 鞐芽njjづ+
嵋
U・
TWガYH 虻 ---
Platform Shutdown Device : ---
Firmware Base ``鞐鞐X挨dL^0ppppp
Firmware Size 鞐鞐隶360 KB
Runtime SBI Version ``H.3
Domain0 Name ``鞐_霎鞣|'X・
W?+V
萌
覃(*UH``>'・C・main0 HARTs 玻鞐X鞣x・b
RbRbRb・jつ蟀+V
蜂嶽㌦
$$Hx 鞐雕`px00000000p2000000-0x00000000p200ffff (I)
Domain0 Region01 鞐鞐x00000鍵<0000ppp-0x000000004007ffff ()
Domain0 Region02 鞐鞐#dn00000pppp00-0xffffffffffffffff (R,W,X)
Domain0 Next Address 雕 px0000000p40200000
x000000<220pp00g1 `鞐鞐
Lomain0 Next Mode ``鞐O萎S-mode
Domain0 SysReset ``鞐 .Y・|!・
・*UHR・```隶霎l憊0
Boot HART 弟main `鞐霍`尞ot
Boot HART Priv Version v1.11
Boot HART Base ISA ``武瑁:`rv64imafdcbx
Boot HART ISA Gxtensions : none
Boot HART PMp Count ``雕`8
Boot HART pMP`・・W-W/$'HMN瘴ot HART PMP Allress Bits: 34
Boot HART MHpM Count 雕 2
°
・*U飯R・ρ$,愽韶鞐汰疏Bjい裨
・*UHSQ・ρ$,犯0萎x0000000000b109
U-Boot 2021.10 (Oct 31 022`- 12:11:37 +0800), Build: jenkins-VF2_515_Branch_SDK_Release-10
CPU: 事64imacu
Model: StarFive VisionFive V2
DRAM: `4 GiB
MMC: sdio0@16010000: 0, sdio1@16020000:`0
Loading Environment from SPIFlash... SF: Detected gd25lq128 with page size 256 Bytes, erase size 4 KiB, 逸tal 16 MiB
*** Warning - bad CRC,`using default environment
StarFive EEPROM format v2
--------EEPROM INFO--------
Vendor : StarFive Technology Co., Ltd.
Product full SN: VF7110A1-2249-D004E00p-00000617
data version: 0x2
PCB 劫vision: 0xa1
BOM revision: A
Ethernet MAC0 address: 6c:cf:39:00:18:2f
Ethernet MAC1 address: 6c:cf:39:00:18:30
--------EEPROM INFO--------
In: `serial@10000000
ナコ 熈ラ・リ 怯ーーーーーーーut: `・・X 怯0000ppp
ヘ・褌コ モ鴕・ヨ鴣鴆鏆鴕・ヨイ
ホ襁コ 襁隹コ 襁韃襁タアカーウーーーーャ 襁雎コ 襁韃襁タアカーエーーーー
鴟肛 鴟鴆ⅴ 」ーャ マヒ
澵羈 鴣 脉褓・蒟肄
跣・蒟肄 ア
糀・瀅蒟 跪碯・蒟肄 ア
テ碚ァ・・粮・・蒟肄
ニ硅・・ ・砌 ァッ糀・ッⅷョ
ネ鴟 碚・・・ ・ 磆糀・コ ー
テ碚ァ・・粮・・蒟肄
ノ瀇・鰀 褓・褓・踉・ 澵羈 ョョョ
」」 ラ碪鵫鰀コ ノⅱ 蓊 褸肄裝・アーエクオキカ 糴・ュ 聶・
」」 ノ鮻・ 鴃・蓊 栁 ス アーエクオキク ス ーーーイ
」」 ナ・コ 「糀・イ「 ⅰ・蒟跌鮱・
鴟肛 鴟鴆ⅴ 」ーャ マヒ
澵羈 鴣 脉褓・蒟肄
モ聶・鴃・澵・アコイョョョ
ニ・鮏 ッ糀・ッ褸鴃ッ褸鴃ョ胥鮻
メ襁褻鴃・跌・コ ッ糀・ッ褸鴃ッ褸鴃ョ胥鮻
クカウ 糴・砌 鴃 オ 炫 ィアカク ヒ鯆ッ
ユュツ・・淲ⅶ
アコ ト裘鱆・ヌホユッフ鴃 糀・ッ・オョアオョーュ碪跌
イコ ト裘鱆・ヌホユッフ鴃 糀・ッ・オョアオョーュ碪跌 ィ 襁ゥ
ナⅵ褪 肛・肄コ
not found
U-Boot menu
1: Debian GNU/Linux bookworm/sid 5.15.0-starfive
2: Debian GNU/Linux bookworm/sid 5.15.0-starfive (rescue target)
Enter choice: 1
1: Debian GNU/Linux bookworm/sid 5.15.0-starfive
Retrieving file: /boot/initrd.img-5.15.0-starfive
9684944 bytes read in 409 ms (22.6 MiB/s)
Retrieving file: /boot/vmlinuz-5.15.0-starfive
8015160 bytes read in 341 ms (22.4 MiB/s)
append: root=/dev/mmcblk1p3 root=/dev/mmcblk1p3 rw console=tty0 console=ttyS0,115200 earlycon rootwait stmmaceth=chain_mode:1 selinux=0
Retrieving file: /boot/dtbs/starfive/starfive_visionfive2.dtb
Failed to load '/boot/dtbs/starfive/starfive_visionfive2.dtb'
kernel_comp_addr_r or kernel_comp_size is not provided!
2: Debian GNU/Linux bookworm/sid 5.15.0-starfive (rescue target)
Retrieving file: /boot/initrd.img-5.15.0-starfive
9684944 bytes read in 410 ms (22.5 MiB/s)
Retrieving file: /boot/vmlinuz-5.15.0-starfive
8015160 bytes read in 342 ms (22.4 MiB/s)
append: root=/dev/mmcblk1p3 root=/dev/mmcblk1p3 rw console=tty0 console=ttyS0,115200 earlycon rootwait stmmaceth=chain_mode:1 selinux=0 single
Retrieving file: /boot/dtbs/starfive/starfive_visionfive2.dtb
Failed to load '/boot/dtbs/starfive/starfive_visionfive2.dtb'
kernel_comp_addr_r or kernel_comp_size is not provided!
SCRIPT FAILED:`continuing...
libfdt fdt_check_header(): FDT_ERR_BADMAGIC
Card did not respond to voltage select! : -110
** Unable to read file ubootefi.var **
Failed to load EFI variables
Scanning mmc 1:3...
libfdt fdt_check_header(): FDT_ERR_BADMAGIC
ethernet@16030000 Waiting for PHY auto negotiation to complete......... TIMEOUT !
phy_startup() failed: -110FAILED: -110ethernet@1604000p Waiting for PHY auto negotiation to complete.... done
BOOTP broadcast 1
DHCP client bound to address 192.168.1.135 (9 ms)
Using ethernet@16040000 峨vice
TFTP from server 192.168.1.1; our IP address is 192.168.1.135
Filename 'boot.scr.uimg'.
Load address: 0x88100000
Loading: *
TFTP server died; starting again
BOOTP broadcast 1
DHCP client bound to address 192.168.1.135 (5 ms)
Using ethernet@16040000`"evice
TFTP`from server 192.168.1.1; our IP X屋ess is 192.168.1.135
Filename 'boot.scr.uimg'.
Load address: 0x44000000
\oading: *
TFTP server died; starting again
StarFive #
うーん・・・起動に失敗してますね。
2023/01/12追記:Image-69で起動が失敗する件は「StarFive Vision Five 2の2022年12月出荷分を使うには面倒くさい手順が必要」で解消できます。
Image-55を書き込んで起動してみます。
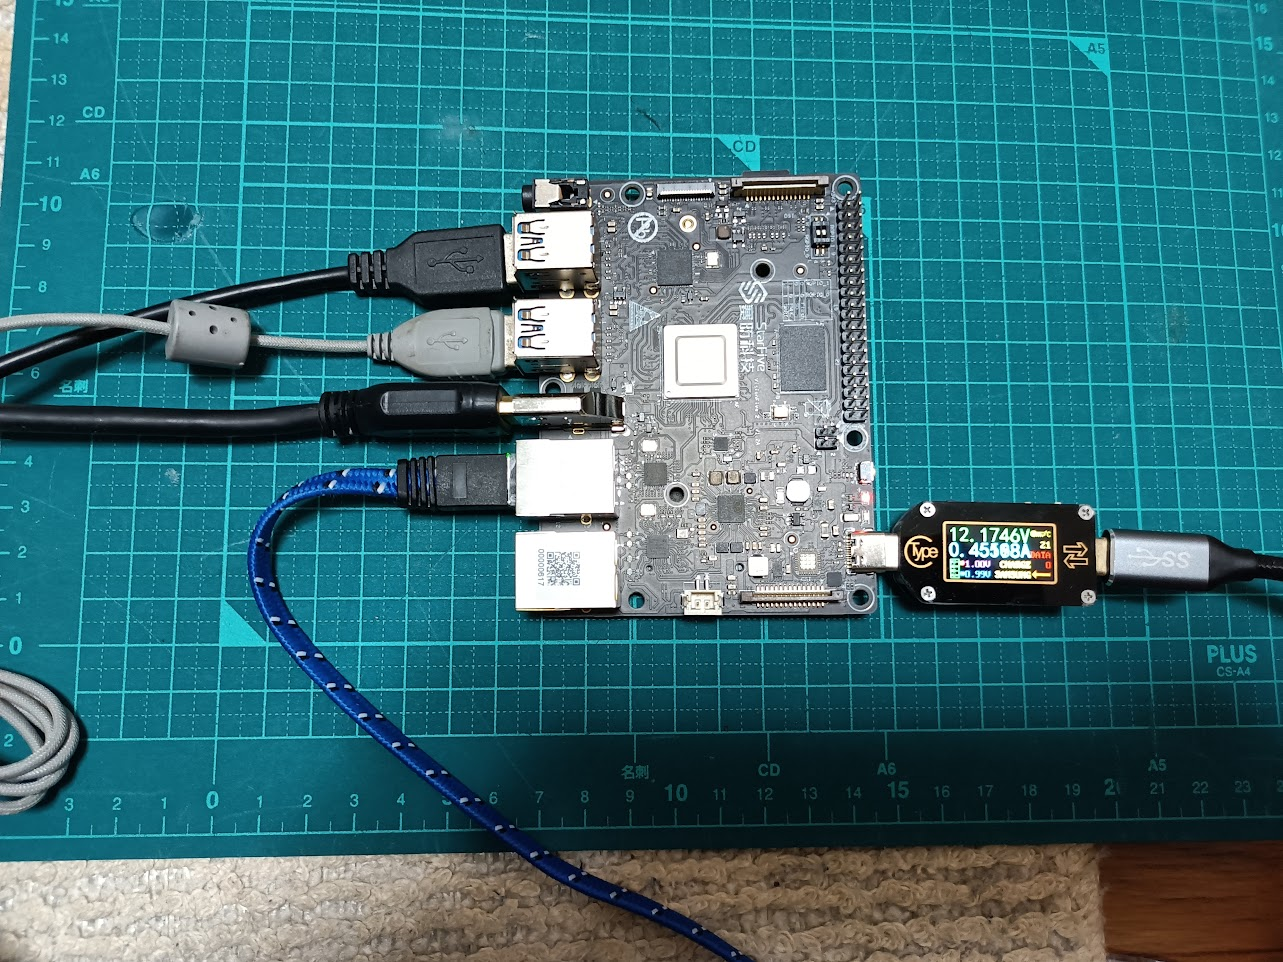
Type-C PD電源を繋ぐと12Vで給電されました。秋月で売ってる5.1V3.8Aアダプタでも動きました。
ログインは「root」、パスワードは「starfive」です。
Image-55で起動した場合のdmesg
root@starfive:~# dmesg
[    0.000000] Linux version 5.15.0-starfive (sw_buildbot@mdcsw02) (riscv64-unknown-linux-gnu-gcc (GCC) 10.2.0, GNU ld (GNU Binutils) 2.35) #1 SMP Fri Nov 11 06:58:52 EST 2022
[    0.000000] OF: fdt: Ignoring memory range 0x40000000 - 0x40200000
[    0.000000] Machine model: StarFive VisionFive V2
[    0.000000] earlycon: uart0 at MMIO32 0x0000000010000000 (options '115200')
[    0.000000] printk: bootconsole [uart0] enabled
[    0.000000] efi: UEFI not found.
[    0.000000] Reserved memory: created CMA memory pool at 0x0000000080000000, size 512 MiB
[    0.000000] OF: reserved mem: initialized node linux,cma, compatible id shared-dma-pool
[    0.000000] Zone ranges:
[    0.000000]   DMA32    [mem 0x0000000040200000-0x00000000ffffffff]
[    0.000000]   Normal   [mem 0x0000000100000000-0x000000013fffffff]
[    0.000000] Movable zone start for each node
[    0.000000] Early memory node ranges
[    0.000000]   node   0: [mem 0x0000000040200000-0x00000000c010ffff]
[    0.000000]   node   0: [mem 0x00000000c0110000-0x00000000c01fffff]
[    0.000000]   node   0: [mem 0x00000000c0200000-0x000000013fffffff]
[    0.000000] Initmem setup node 0 [mem 0x0000000040200000-0x000000013fffffff]
[    0.000000] SBI specification v0.3 detected
[    0.000000] SBI implementation ID=0x1 Version=0x10000
[    0.000000] SBI TIME extension detected
[    0.000000] SBI IPI extension detected
[    0.000000] SBI RFENCE extension detected
[    0.000000] SBI v0.2 HSM extension detected
[    0.000000] CPU with hartid=0 is not available
[    0.000000] CPU with hartid=0 is not available
[    0.000000] riscv: ISA extensions acdfim
[    0.000000] riscv: ELF capabilities acdfim
[    0.000000] percpu: Embedded 17 pages/cpu s31528 r8192 d29912 u69632
[    0.000000] pcpu-alloc: s31528 r8192 d29912 u69632 alloc=17*4096
[    0.000000] pcpu-alloc: [0] 0 [0] 1 [0] 2 [0] 3
[    0.000000] Built 1 zonelists, mobility grouping on.  Total pages: 1033735
[    0.000000] Kernel command line: root=/dev/mmcblk1p3 rw console=tty0 console=ttyS0,115200 earlycon rootwait stmmaceth=chain_mode:1 selinux=0
[    0.000000] Unknown command line parameters: stmmaceth=chain_mode:1 selinux=0
[    0.000000] Dentry cache hash table entries: 524288 (order: 10, 4194304 bytes, linear)
[    0.000000] Inode-cache hash table entries: 262144 (order: 9, 2097152 bytes, linear)
[    0.000000] mem auto-init: stack:off, heap alloc:off, heap free:off
[    0.000000] software IO TLB: mapped [mem 0x00000000fbfff000-0x00000000fffff000] (64MB)
[    0.000000] Memory: 3451376K/4192256K available (9735K kernel code, 4976K rwdata, 4096K rodata, 2191K init, 399K bss, 216592K reserved, 524288K cma-reserved)
[    0.000000] SLUB: HWalign=64, Order=0-3, MinObjects=0, CPUs=4, Nodes=1
[    0.000000] rcu: Hierarchical RCU implementation.
[    0.000000] rcu:     RCU restricting CPUs from NR_CPUS=8 to nr_cpu_ids=4.
[    0.000000] rcu:     RCU debug extended QS entry/exit.
[    0.000000]  Tracing variant of Tasks RCU enabled.
[    0.000000] rcu: RCU calculated value of scheduler-enlistment delay is 10 jiffies.
[    0.000000] rcu: Adjusting geometry for rcu_fanout_leaf=16, nr_cpu_ids=4
[    0.000000] NR_IRQS: 64, nr_irqs: 64, preallocated irqs: 0
[    0.000000] CPU with hartid=0 is not available
[    0.000000] riscv-intc: unable to find hart id for /cpus/cpu@0/interrupt-controller
[    0.000000] riscv-intc: 64 local interrupts mapped
[    0.000000] plic: plic@c000000: mapped 136 interrupts with 4 handlers for 9 contexts.
[    0.000000] random: get_random_bytes called from start_kernel+0x4d0/0x6e2 with crng_init=0
[    0.000000] riscv_timer_init_dt: Registering clocksource cpuid [0] hartid [4]
[    0.000000] clocksource: riscv_clocksource: mask: 0xffffffffffffffff max_cycles: 0x1d854df40, max_idle_ns: 881590404240 ns
[    0.000001] sched_clock: 64 bits at 4MHz, resolution 250ns, wraps every 2199023255500ns
[    0.008951] clocksource: timer@13050000.ch0: mask: 0xffffffff max_cycles: 0xffffffff, max_idle_ns: 79635851949 ns
[    0.020261] clocksource: timer@13050000.ch1: mask: 0xffffffff max_cycles: 0xffffffff, max_idle_ns: 79635851949 ns
[    0.031576] clocksource: timer@13050000.ch2: mask: 0xffffffff max_cycles: 0xffffffff, max_idle_ns: 79635851949 ns
[    0.042886] clocksource: timer@13050000.ch3: mask: 0xffffffff max_cycles: 0xffffffff, max_idle_ns: 79635851949 ns
[    0.054338] Console: colour dummy device 80x25
[    0.060268] printk: console [tty0] enabled
[    0.064812] Calibrating delay loop (skipped), value calculated using timer frequency.. 8.00 BogoMIPS (lpj=40000)
[    0.076021] pid_max: default: 32768 minimum: 301
[    0.081254] Mount-cache hash table entries: 8192 (order: 4, 65536 bytes, linear)
[    0.089480] Mountpoint-cache hash table entries: 8192 (order: 4, 65536 bytes, linear)
[    0.099361] ASID allocator disabled
[    0.103295] rcu: Hierarchical SRCU implementation.
[    0.108721] EFI services will not be available.
[    0.114054] smp: Bringing up secondary CPUs ...
[    0.120457] smp: Brought up 1 node, 4 CPUs
[    0.126075] devtmpfs: initialized
[    0.135754] clocksource: jiffies: mask: 0xffffffff max_cycles: 0xffffffff, max_idle_ns: 19112604462750000 ns
[    0.146600] futex hash table entries: 1024 (order: 4, 65536 bytes, linear)
[    0.166989] pinctrl core: initialized pinctrl subsystem
[    0.173535] NET: Registered PF_NETLINK/PF_ROUTE protocol family
[    0.180666] cpuidle: using governor menu
[    0.201831] platform 29400000.dc8200: Fixing up cyclic dependency with soc:rgb-output
[    0.210774] platform soc:dsi-output: Fixing up cyclic dependency with 29400000.dc8200
[    0.219803] platform 295d0000.mipi: Fixing up cyclic dependency with soc:dsi-output
[    0.228563] platform 29590000.hdmi: Fixing up cyclic dependency with 29400000.dc8200
[    0.246590] HugeTLB registered 1.00 GiB page size, pre-allocated 0 pages
[    0.253988] HugeTLB registered 2.00 MiB page size, pre-allocated 0 pages
[    0.264114] vgaarb: loaded
[    0.267293] SCSI subsystem initialized
[    0.271540] libata version 3.00 loaded.
[    0.271686] usbcore: registered new interface driver usbfs
[    0.277769] usbcore: registered new interface driver hub
[    0.283635] usbcore: registered new device driver usb
[    0.289270] mc: Linux media interface: v0.10
[    0.293981] videodev: Linux video capture interface: v2.00
[    0.300191] Advanced Linux Sound Architecture Driver Initialized.
[    0.307205] Bluetooth: Core ver 2.22
[    0.311174] NET: Registered PF_BLUETOOTH protocol family
[    0.317014] Bluetooth: HCI device and connection manager initialized
[    0.324011] Bluetooth: HCI socket layer initialized
[    0.329379] Bluetooth: L2CAP socket layer initialized
[    0.334950] Bluetooth: SCO socket layer initialized
[    0.340680] clocksource: Switched to clocksource riscv_clocksource
[    0.353211] NET: Registered PF_INET protocol family
[    0.359048] IP idents hash table entries: 65536 (order: 7, 524288 bytes, linear)
[    0.370394] tcp_listen_portaddr_hash hash table entries: 2048 (order: 4, 81920 bytes, linear)
[    0.379897] TCP established hash table entries: 32768 (order: 6, 262144 bytes, linear)
[    0.388975] TCP bind hash table entries: 32768 (order: 8, 1048576 bytes, linear)
[    0.398232] TCP: Hash tables configured (established 32768 bind 32768)
[    0.405693] UDP hash table entries: 2048 (order: 5, 196608 bytes, linear)
[    0.413368] UDP-Lite hash table entries: 2048 (order: 5, 196608 bytes, linear)
[    0.421739] NET: Registered PF_UNIX/PF_LOCAL protocol family
[    0.428445] RPC: Registered named UNIX socket transport module.
[    0.434983] RPC: Registered udp transport module.
[    0.440153] RPC: Registered tcp transport module.
[    0.445335] RPC: Registered tcp NFSv4.1 backchannel transport module.
[    0.452999] PCI: CLS 0 bytes, default 64
[    0.457838] Initialise system trusted keyrings
[    0.462904] workingset: timestamp_bits=62 max_order=20 bucket_order=0
[    0.463103] Unpacking initramfs...
[    0.474979] NFS: Registering the id_resolver key type
[    0.480567] Key type id_resolver registered
[    0.485205] Key type id_legacy registered
[    0.489715] nfs4filelayout_init: NFSv4 File Layout Driver Registering...
[    0.497124] nfs4flexfilelayout_init: NFSv4 Flexfile Layout Driver Registering...
[    0.505333] ntfs: driver 2.1.32 [Flags: R/W].
[    0.510544] fuse: init (API version 7.34)
[    0.546191] NET: Registered PF_ALG protocol family
[    0.551521] Key type asymmetric registered
[    0.556040] Asymmetric key parser 'x509' registered
[    0.561512] Block layer SCSI generic (bsg) driver version 0.4 loaded (major 249)
[    0.569665] io scheduler mq-deadline registered
[    0.574683] io scheduler kyber registered
[    0.580841] start plist test
[    0.584361] end plist test
[    0.663781] clk-starfive-jh7110 13020000.clock-controller: starfive JH7110 clkgen init successfully.
[    0.675015] L2CACHE: DataError @ 0x00000000.08040110
[    0.680559] L2CACHE: DataFail @ 0x00000000.08040140
[    0.686063] L2CACHE: No. of Banks in the cache: 8
[    0.691275] L2CACHE: No. of ways per bank: 16
[    0.696083] L2CACHE: Sets per bank: 256
[    0.700317] L2CACHE: Bytes per cache block: 64
[    0.705263] L2CACHE: Index of the largest way enabled: 15
[    0.711557] jh7110-pmu 17030000.power-controller: registered 8 power domains
[    0.778505] Serial: 8250/16550 driver, 6 ports, IRQ sharing disabled
[    0.798718] @@#########################@@
[    0.841091] @@ dev ptr:ffffffe0bfee0000/1500/1
[    0.846243] PVR_K:  1: Read BVNC 36.50.54.182 from HW device registers
[    0.853536] PVR_K:  1: RGX Device registered BVNC 36.50.54.182 with 1 core in the system
[    0.863719] [drm] Initialized pvr 1.17.6210866 20170530 for 18000000.gpu on minor 0
[    0.882617] loop: module loaded
[    0.888040] libphy: Fixed MDIO Bus: probed
[    0.894178] CAN device driver interface
[    0.899029] starfive-eth-plat 16030000.ethernet: force_sf_dma_mode is ignored if force_thresh_dma_mode is set.
[    0.910539] starfive-eth-plat 16030000.ethernet: User ID: 0x41, Synopsys ID: 0x52
[    0.918854] starfive-eth-plat 16030000.ethernet:     DWMAC4/5
[    0.924950] starfive-eth-plat 16030000.ethernet: DMA HW capability register supported
[    0.933612] starfive-eth-plat 16030000.ethernet: RX Checksum Offload Engine supported
[    0.942293] starfive-eth-plat 16030000.ethernet: Wake-Up On Lan supported
[    0.949784] starfive-eth-plat 16030000.ethernet: TSO supported
[    0.956250] starfive-eth-plat 16030000.ethernet: Enable RX Mitigation via HW Watchdog Timer
[    0.965505] starfive-eth-plat 16030000.ethernet: Enabled Flow TC (entries=1)
[    0.973305] starfive-eth-plat 16030000.ethernet: TSO feature enabled
[    0.980318] starfive-eth-plat 16030000.ethernet: Using 40 bits DMA width
[    1.124750] Freeing initrd memory: 9456K
[    1.384601] libphy: stmmac: probed
[    1.388379] YT8531 Gigabit Ethernet stmmac-0:00: attached PHY driver (mii_bus:phy_addr=stmmac-0:00, irq=POLL)
[    1.399339] YT8531 Gigabit Ethernet stmmac-0:01: attached PHY driver (mii_bus:phy_addr=stmmac-0:01, irq=POLL)
[    1.411585] starfive-eth-plat 16040000.ethernet: force_sf_dma_mode is ignored if force_thresh_dma_mode is set.
[    1.423012] starfive-eth-plat 16040000.ethernet: User ID: 0x41, Synopsys ID: 0x52
[    1.431295] starfive-eth-plat 16040000.ethernet:     DWMAC4/5
[    1.437346] starfive-eth-plat 16040000.ethernet: DMA HW capability register supported
[    1.445989] starfive-eth-plat 16040000.ethernet: RX Checksum Offload Engine supported
[    1.454632] starfive-eth-plat 16040000.ethernet: Wake-Up On Lan supported
[    1.462120] starfive-eth-plat 16040000.ethernet: TSO supported
[    1.468551] starfive-eth-plat 16040000.ethernet: Enable RX Mitigation via HW Watchdog Timer
[    1.477783] starfive-eth-plat 16040000.ethernet: Enabled Flow TC (entries=1)
[    1.485565] starfive-eth-plat 16040000.ethernet: TSO feature enabled
[    1.492576] starfive-eth-plat 16040000.ethernet: Using 40 bits DMA width
[    1.751521] libphy: stmmac: probed
[    1.755297] YT8512B Ethernet stmmac-1:00: attached PHY driver (mii_bus:phy_addr=stmmac-1:00, irq=POLL)
[    1.765604] YT8512B Ethernet stmmac-1:03: attached PHY driver (mii_bus:phy_addr=stmmac-1:03, irq=POLL)
[    1.777445] Intel(R) Wireless WiFi driver for Linux
[    1.784774] cdns3-starfive 10210000.usbdrd: usb mode 2 2.0 probe success
[    1.792913] usbcore: registered new interface driver uas
[    1.798823] usbcore: registered new interface driver usb-storage
[    1.821012] starfive-rtc 17040000.rtc: registered as rtc0
[    1.826978] starfive-rtc 17040000.rtc: setting system clock to 2001-01-01T00:00:00 UTC (978307200)
[    1.837020] i2c_dev: i2c /dev entries driver
[    1.842173] usbcore: registered new interface driver uvcvideo
[    1.849628] starfive-wdt 13070000.wdog: Heartbeat: timeout=15, count/2=180000000 (0aba9500)
[    1.859373] Bluetooth: HCI UART driver ver 2.3
[    1.864298] Bluetooth: HCI UART protocol H4 registered
[    1.870170] starfive-cpufreq soc:starfive,jh7110-cpufreq: Failed to get regulator for cpu!
[    1.879313] starfive-cpufreq soc:starfive,jh7110-cpufreq: Failed to init starfive cpu dvfs info
[    1.889570] cpuidle-riscv-sbi: idle driver registered for all CPUs
[    1.896727] sdhci: Secure Digital Host Controller Interface driver
[    1.903568] sdhci: Copyright(c) Pierre Ossman
[    1.908398] Synopsys Designware Multimedia Card Interface Driver
[    1.915320] sdhci-pltfm: SDHCI platform and OF driver helper
[    1.922343] jh7110-sec 16000000.crypto: Unable to request sec_m dma channel in DMA channel
[    1.931491] jh7110-sec 16000000.crypto: Cannot initial dma chan
[    1.938323] usbcore: registered new interface driver usbhid
[    1.944501] usbhid: USB HID core driver
[    1.948990] usbcore: registered new interface driver snd-usb-audio
[    1.958869] NET: Registered PF_PACKET protocol family
[    1.964489] can: controller area network core
[    1.969410] NET: Registered PF_CAN protocol family
[    1.974720] can: raw protocol
[    1.977994] can: broadcast manager protocol
[    1.982641] can: netlink gateway - max_hops=1
[    1.987755] Bluetooth: RFCOMM TTY layer initialized
[    1.993184] Bluetooth: RFCOMM socket layer initialized
[    1.998872] Bluetooth: RFCOMM ver 1.11
[    2.003035] Bluetooth: BNEP (Ethernet Emulation) ver 1.3
[    2.008890] Bluetooth: BNEP filters: protocol multicast
[    2.014674] Bluetooth: BNEP socket layer initialized
[    2.020319] 9pnet: Installing 9P2000 support
[    2.025103] Key type dns_resolver registered
[    2.030602] Loading compiled-in X.509 certificates
[    2.072105] starfive_jh7110-pinctrl 13040000.gpio: SiFive GPIO chip registered 64 GPIOs
[    2.081740] starfive_jh7110-pinctrl 17020000.gpio: SiFive GPIO chip registered 4 GPIOs
[    2.090717] pl08xdmac 16008000.sec_dma: initialized 8 virtual memcpy channels
[    2.098603] pl08xdmac 16008000.sec_dma: initialized 16 virtual slave channels
[    2.107989] debugfs: Directory '16008000.sec_dma' with parent 'dmaengine' already present!
[    2.117159] pl08xdmac 16008000.sec_dma: DMA: PL080 rev0 at 0x16008000 irq 22
[    2.127395] pcie_plda 2b000000.pcie: host bridge /soc/pcie@2B000000 ranges:
[    2.135184] pcie_plda 2b000000.pcie:      MEM 0x0030000000..0x0037ffffff -> 0x0030000000
[    2.144142] pcie_plda 2b000000.pcie:      MEM 0x0900000000..0x093fffffff -> 0x0900000000
[    2.153125] ATR entry: 0x0940000000 -> 0x0000000000 [0x0010000000] (param: 0x000001)
[    2.161696] ATR entry: 0x0030000000 -> 0x0030000000 [0x0008000000] (param: 0x000000)
[    2.170244] ATR entry: 0x0900000000 -> 0x0900000000 [0x0040000000] (param: 0x000000)
[    2.520712] pcie_plda 2b000000.pcie: Port link up.
[    2.526140] pcie_plda 2b000000.pcie: PCI host bridge to bus 0000:00
[    2.533078] pci_bus 0000:00: root bus resource [bus 00-ff]
[    2.539131] pci_bus 0000:00: root bus resource [mem 0x30000000-0x37ffffff]
[    2.546733] pci_bus 0000:00: root bus resource [mem 0x900000000-0x93fffffff pref]
[    2.555028] pci 0000:00:00.0: [1556:1111] type 01 class 0x078000
[    2.561674] pci 0000:00:00.0: reg 0x10: [mem 0x00000000-0xffffffff 64bit pref]
[    2.569702] pci 0000:00:00.0: supports D1 D2
[    2.574420] pci 0000:00:00.0: PME# supported from D0 D1 D2 D3hot D3cold
[    2.585107] pci 0000:00:00.0: bridge configuration invalid ([bus 00-00]), reconfiguring
[    2.594081] pci 0000:01:00.0: [1106:3483] type 00 class 0x0c0330
[    2.600737] pci 0000:01:00.0: reg 0x10: [mem 0x00000000-0x00000fff 64bit]
[    2.608302] pci 0000:01:00.0: PME# supported from D0 D3cold
[    2.617633] pci_bus 0000:01: busn_res: [bus 01-ff] end is updated to 01
[    2.624971] pci 0000:00:00.0: BAR 0: no space for [mem size 0x100000000 64bit pref]
[    2.633439] pci 0000:00:00.0: BAR 0: failed to assign [mem size 0x100000000 64bit pref]
[    2.642301] pci 0000:00:00.0: BAR 8: assigned [mem 0x30000000-0x300fffff]
[    2.649786] pci 0000:01:00.0: BAR 0: assigned [mem 0x30000000-0x30000fff 64bit]
[    2.657883] pci 0000:00:00.0: PCI bridge to [bus 01]
[    2.663367] pci 0000:00:00.0:   bridge window [mem 0x30000000-0x300fffff]
[    2.670970] pci 0000:00:00.0: enabling device (0000 -> 0002)
[    2.677211] pci 0000:01:00.0: enabling device (0000 -> 0002)
[    2.683495] pci 0000:01:00.0: quirk_usb_early_handoff+0x0/0x9d4 took 12241 usecs
[    2.691888] xhci_hcd 0000:01:00.0: xHCI Host Controller
[    2.697671] xhci_hcd 0000:01:00.0: new USB bus registered, assigned bus number 1
[    2.706274] xhci_hcd 0000:01:00.0: hcc params 0x002841eb hci version 0x100 quirks 0x0000040000000890
[    2.716459] pcie_plda 2b000000.pcie: msi#0 address_hi 0x0 address_lo 0x190
[    2.724442] xhci_hcd 0000:01:00.0: xHCI Host Controller
[    2.730218] xhci_hcd 0000:01:00.0: new USB bus registered, assigned bus number 2
[    2.738398] xhci_hcd 0000:01:00.0: Host supports USB 3.0 SuperSpeed
[    2.746064] hub 1-0:1.0: USB hub found
[    2.750240] hub 1-0:1.0: 1 port detected
[    2.755621] hub 2-0:1.0: USB hub found
[    2.759798] hub 2-0:1.0: 4 ports detected
[    2.766996] pcie_plda 2c000000.pcie: host bridge /soc/pcie@2C000000 ranges:
[    2.774742] pcie_plda 2c000000.pcie:      MEM 0x0038000000..0x003fffffff -> 0x0038000000
[    2.783700] pcie_plda 2c000000.pcie:      MEM 0x0980000000..0x09bfffffff -> 0x0980000000
[    2.792685] ATR entry: 0x09c0000000 -> 0x0000000000 [0x0010000000] (param: 0x000001)
[    2.801252] ATR entry: 0x0038000000 -> 0x0038000000 [0x0008000000] (param: 0x000000)
[    2.809802] ATR entry: 0x0980000000 -> 0x0980000000 [0x0040000000] (param: 0x000000)
[    2.970743] usb usb2-port2: over-current condition
[    3.070737] usb 1-1: new high-speed USB device number 2 using xhci_hcd
[    3.130747] usb usb2-port4: over-current condition
[    3.253597] hub 1-1:1.0: USB hub found
[    3.257984] hub 1-1:1.0: 4 ports detected
[    3.260710] pcie_plda 2c000000.pcie: Port link down, exit.
[    3.282096] clk-starfive-jh7110-vout 295c0000.clock-controller: starfive JH7110 clk_vout init successfully.
[    3.304537] clk-starfive-jh7110-isp 19810000.clock-controller: starfive JH7110 clk_isp init successfully.
[    3.315710] dw_axi_dmac_platform 16050000.dma-controller: DesignWare AXI DMA Controller, 4 channels
[    3.326746] printk: console [ttyS0] disabled
[    3.351719] 10000000.serial: ttyS0 at MMIO 0x10000000 (irq = 16, base_baud = 1500000) is a 16550A
[    3.361568] printk: console [ttyS0] enabled
[    3.370359] printk: bootconsole [uart0] disabled
[    3.381804] i2c 2-0045: Fixing up cyclic dependency with 295d0000.mipi
[    3.389408] at24 5-0050: supply vcc not found, using dummy regulator
[    3.396656] at24 5-0050: 512 byte 24c04 EEPROM, writable, 16 bytes/write
[    3.405372] axp15060-regulator 5-0036: Register mipi_0p9 done! vol range:900 ~ 900 mV
[    3.414787] axp15060-regulator 5-0036: Register hdmi_1p8 done! vol range:1800 ~ 1800 mV
[    3.424389] axp15060-regulator 5-0036: Register hdmi_0p9 done! vol range:900 ~ 900 mV
[    3.433838] axp15060-regulator 5-0036: Register cpu_vdd done! vol range:500 ~ 1540 mV
[    3.442572] i2c 6-0010: Fixing up cyclic dependency with 19800000.vin_sysctl
[    3.450095] imx219 6-0010: supply VANA not found, using dummy regulator
[    3.456883] imx219 6-0010: supply VDIG not found, using dummy regulator
[    3.463597] imx219 6-0010: supply VDDL not found, using dummy regulator
[    3.477772] imx219 6-0010: failed to read chip id 219
[    3.483082] imx219: probe of 6-0010 failed with error -5
[    3.488714] jh7110-vin 19800000.vin_sysctl: stfcamss probe enter!
[    3.496856] jh7110-vin 19800000.vin_sysctl: stfcamss probe success!
[    3.505556] dwmmc_starfive 16010000.sdio0: IDMAC supports 32-bit address mode.
[    3.505942] jh7110-sec 16000000.crypto: Unbalanced pm_runtime_enable!
[    3.505953] dwmmc_starfive 16020000.sdio1: IDMAC supports 32-bit address mode.
[    3.505999] dwmmc_starfive 16020000.sdio1: Using internal DMA controller.
[    3.506011] dwmmc_starfive 16020000.sdio1: Version ID is 290a
[    3.506055] dwmmc_starfive 16020000.sdio1: DW MMC controller at irq 29,32 bit host data width,32 deep fifo
[    3.506187] mmc_host mmc1: card is polling.
[    3.512885] dwmmc_starfive 16010000.sdio0: Using internal DMA controller.
[    3.519522] jh7110-sec 16000000.crypto: will run requests pump with realtime priority
[    3.526563] dwmmc_starfive 16010000.sdio0: Version ID is 290a
[    3.526606] dwmmc_starfive 16010000.sdio0: DW MMC controller at irq 28,32 bit host data width,32 deep fifo
[    3.536755] jh7110-sec 16000000.crypto: Initialized
[    3.539265] mmc_host mmc0: card is non-removable.
[    3.549734] starfive-i2s 120b0000.i2stx_4ch0:  designware: play supported
[    3.599640] sf-mipi-dphy-tx 295e0000.mipi-dphy: sf_dphy_probe begin
[    3.605929] sf-mipi-dphy-tx 295e0000.mipi-dphy: ===> sf_dphy_probe enter, 715
[    3.613230] sf-mipi-dphy-tx 295e0000.mipi-dphy: control ECO
[    3.618813] sf-mipi-dphy-tx 295e0000.mipi-dphy: GET_AON_GP_REG
[    3.624661] sf-mipi-dphy-tx 295e0000.mipi-dphy: control ECO
[    3.630242] sf-mipi-dphy-tx 295e0000.mipi-dphy: supply mipi_1p8 not found, using dummy regulator
[    3.639817] sf-mipi-dphy-tx 295e0000.mipi-dphy: sf_dphy_probe end
[    3.646730] of_cfs_init
[    3.649207] of_cfs_init: OK
[    3.652346] starfive-pwmdac 100b0000.pwmdac: clk_apb0 = 49500000, clk_pwmdac_apb = 49500000, clk_pwmdac_core = 4068493
[    3.663331] cfg80211: Loading compiled-in X.509 certificates for regulatory database
[    3.720730] mmc_host mmc1: Bus speed (slot 0) = 198000000Hz (slot req 400000Hz, actual 399193HZ div = 248)
[    3.770733] mmc_host mmc0: Bus speed (slot 0) = 198000000Hz (slot req 400000Hz, actual 399193HZ div = 248)
[    3.783466] cfg80211: Loaded X.509 cert 'sforshee: 00b28ddf47aef9cea7'
[    3.795170] starfive soc:display-subsystem: bound 29400000.dc8200 (ops 0xffffffff80e73520)
[    3.804660] platform regulatory.0: Direct firmware load for regulatory.db failed with error -2
[    3.813391] cfg80211: failed to load regulatory.db
[    3.813866] innohdmi-starfive 29590000.hdmi: [drm:inno_hdmi_bind] registered Inno HDMI I2C bus driver success
[    3.828513] innohdmi-starfive 29590000.hdmi: HDMI&AUDIO register done.
[    3.835084] starfive soc:display-subsystem: bound 29590000.hdmi (ops 0xffffffff80e742d0)
[    3.843224] cdns-dsi 295d0000.mipi: dsi_sys_clk = 297000000
[    3.849125] seeed_panel 2-0045: Unknown Atmel firmware revision: 0x00
[    3.855621] cdns-dsi 295d0000.mipi: ====starfive_dsi_bind end
[    3.861381] starfive soc:display-subsystem: bound 295d0000.mipi (ops 0xffffffff80e74bf8)
[    3.869480] vs-simple-encoder soc:rgb-output: encoder_bind begin
[    3.875512] no panel, -19
[    3.878137] vs-simple-encoder soc:rgb-output: encoder_bind error
[    3.884154] starfive soc:display-subsystem: bound soc:rgb-output (ops 0xffffffff80e73f18)
[    3.892346] vs-simple-encoder soc:dsi-output: encoder_bind begin
[    3.898369] no panel, -517
[    3.901089] vs-simple-encoder soc:dsi-output: encoder_bind error
[    3.907098] starfive soc:display-subsystem: bound soc:dsi-output (ops 0xffffffff80e73f18)
[    3.915707] [drm] Initialized starfive 1.0.0 20191101 for soc:display-subsystem on minor 1
[    3.973293] mmc_host mmc1: Bus speed (slot 0) = 198000000Hz (slot req 50000000Hz, actual 49500000HZ div = 2)
[    3.983329] mmc1: new high speed SDXC card at address 59b4
[    3.989952] mmcblk1: mmc1:59b4 EC1S5 59.7 GiB
[    3.997978] random: fast init done
[    4.006417]  mmcblk1: p1 p2 p3
[    4.220791] mmc_host mmc0: Bus speed (slot 0) = 198000000Hz (slot req 300000Hz, actual 300000HZ div = 330)
[    4.660818] mmc_host mmc0: Bus speed (slot 0) = 198000000Hz (slot req 200000Hz, actual 200000HZ div = 495)
[    5.110840] mmc_host mmc0: Bus speed (slot 0) = 198000000Hz (slot req 100000Hz, actual 100000HZ div = 990)
[    6.010795] ALSA device list:
[    6.013815]   #0: Starfive-Multi-Sound-Card
[    6.022341] Freeing unused kernel image (initmem) memory: 2188K
[    6.028625] Run /init as init process
[    6.032400]   with arguments:
[    6.032417]     /init
[    6.032430]   with environment:
[    6.032446]     HOME=/
[    6.032459]     TERM=linux
[    6.032473]     stmmaceth=chain_mode:1
[    6.032492]     selinux=0
[    6.967245] EXT4-fs (mmcblk1p3): mounted filesystem with ordered data mode. Opts: (null). Quota mode: disabled.
[    7.670380] systemd[1]: System time before build time, advancing clock.
[    7.757931] systemd[1]: systemd 251.2-5 running in system mode (+PAM +AUDIT +SELINUX +APPARMOR +IMA +SMACK +SECCOMP +GCRYPT -GNUTLS +OPENSSL +ACL +BLKID +CURL +ELFUTILS +FIDO2 +IDN2 -IDN +IPTC +KMOD +LIBCRYPTSETUP +LIBFDISK +PCRE2 -PWQUALITY -P11KIT -QRENCODE +TPM2 +BZIP2 +LZ4 +XZ +ZLIB +ZSTD -BPF_FRAMEWORK -XKBCOMMON +UTMP +SYSVINIT default-hierarchy=unified)
[    7.789938] systemd[1]: Detected architecture riscv64.
[    7.797636] systemd[1]: Hostname set to <starfive>.
[    8.297379] systemd[1]: Queued start job for default target Graphical Interface.
[    8.306926] systemd[1]: Created slice Slice /system/getty.
[    8.313254] systemd[1]: Created slice Slice /system/modprobe.
[    8.320466] systemd[1]: Created slice Slice /system/serial-getty.
[    8.327723] systemd[1]: Created slice User and Session Slice.
[    8.334726] systemd[1]: Started Forward Password Requests to Wall Directory Watch.
[    8.343640] systemd[1]: Arbitrary Executable File Formats File System Automount Point was skipped because of a failed condition check (ConditionPathExists=/proc/sys/fs/binfmt_misc).
[    8.361195] systemd[1]: Reached target Local Integrity Protected Volumes.
[    8.369271] systemd[1]: Reached target Remote File Systems.
[    8.376146] systemd[1]: Reached target Slice Units.
[    8.382476] systemd[1]: Reached target Swaps.
[    8.388178] systemd[1]: Reached target Local Verity Protected Volumes.
[    8.397220] systemd[1]: Listening on Syslog Socket.
[    8.402482] systemd[1]: Listening on initctl Compatibility Named Pipe.
[    8.416383] systemd[1]: Journal Audit Socket was skipped because of a failed condition check (ConditionSecurity=audit).
[    8.428362] systemd[1]: Listening on Journal Socket (/dev/log).
[    8.435584] systemd[1]: Listening on Journal Socket.
[    8.441896] systemd[1]: Listening on udev Control Socket.
[    8.448543] systemd[1]: Listening on udev Kernel Socket.
[    8.457028] systemd[1]: Mounting Huge Pages File System...
[    8.465269] systemd[1]: Mounting POSIX Message Queue File System...
[    8.474278] systemd[1]: Mounting Kernel Debug File System...
[    8.481112] systemd[1]: Kernel Trace File System was skipped because of a failed condition check (ConditionPathExists=/sys/kernel/tracing).
[    8.495074] systemd[1]: Create List of Static Device Nodes was skipped because of a failed condition check (ConditionFileNotEmpty=/lib/modules/5.15.0-starfive/modules.devname).
[    8.514354] systemd[1]: Starting Load Kernel Module configfs...
[    8.524330] systemd[1]: Starting Load Kernel Module drm...
[    8.532808] systemd[1]: Starting Load Kernel Module fuse...
[    8.544628] systemd[1]: Starting Journal Service...
[    8.572068] systemd[1]: Starting Load Kernel Modules...
[    8.581548] systemd[1]: Starting Remount Root and Kernel File Systems...
[    8.589283] systemd[1]: Repartition Root Disk was skipped because all trigger condition checks failed.
[    8.603335] systemd[1]: Starting Coldplug All udev Devices...
[    8.615456] systemd[1]: Mounted Huge Pages File System.
[    8.622300] systemd[1]: Mounted POSIX Message Queue File System.
[    8.629645] systemd[1]: Mounted Kernel Debug File System.
[    8.636605] systemd[1]: modprobe@configfs.service: Deactivated successfully.
[    8.644429] systemd[1]: Finished Load Kernel Module configfs.
[    8.658110] systemd[1]: modprobe@drm.service: Deactivated successfully.
[    8.666423] systemd[1]: Finished Load Kernel Module drm.
[    8.673666] systemd[1]: modprobe@fuse.service: Deactivated successfully.
[    8.681198] systemd[1]: Finished Load Kernel Module fuse.
[    8.688046] systemd[1]: Started Journal Service.
[    8.749967] systemd-journald[255]: Received client request to flush runtime journal.
[    8.785014] systemd-journald[255]: File /var/log/journal/e593f8ed757a4b42a5589c96d5395702/system.journal corrupted or uncleanly shut down, renaming and replacing.
[    9.488750] systemd-journald[255]: Oldest entry in /var/log/journal/e593f8ed757a4b42a5589c96d5395702/system.journal is older than the configured file retention duration (1month), suggesting rotation.
[    9.507586] systemd-journald[255]: /var/log/journal/e593f8ed757a4b42a5589c96d5395702/system.journal: Journal header limits reached or header out-of-date, rotating.
[    9.632146] jpu: loading out-of-tree module taints kernel.
[    9.633996] vdec: loading out-of-tree module taints kernel.
[    9.639871] SUCCESS alloc_chrdev_region
[    9.650412] vdec 130a0000.vpu_dec: device init.
[    9.656067] SUCCESS alloc_chrdev_region
[    9.662465] cnm_jpu 13090000.jpu: init device.
[    9.901107] random: dbus-daemon: uninitialized urandom read (12 bytes read)
[    9.901828] random: avahi-daemon: uninitialized urandom read (4 bytes read)
[   10.790162] random: dbus-daemon: uninitialized urandom read (12 bytes read)
[   11.230196] starfive-eth-plat 16030000.ethernet eth0: PHY [stmmac-0:00] driver [YT8531 Gigabit Ethernet] (irq=POLL)
[   11.241274] starfive-eth-plat 16030000.ethernet eth0: Register MEM_TYPE_PAGE_POOL RxQ-0
[   11.259625] dwmac4: Master AXI performs fixed burst length
[   11.265199] starfive-eth-plat 16030000.ethernet eth0: No Safety Features support found
[   11.273197] starfive-eth-plat 16030000.ethernet eth0: IEEE 1588-2008 Advanced Timestamp supported
[   11.282499] starfive-eth-plat 16030000.ethernet eth0: configuring for phy/rgmii-id link mode
[   11.294290] starfive-eth-plat 16040000.ethernet eth1: PHY [stmmac-1:00] driver [YT8512B Ethernet] (irq=POLL)
[   11.304774] starfive-eth-plat 16040000.ethernet eth1: Register MEM_TYPE_PAGE_POOL RxQ-0
[   11.313098] dwmac4: Master AXI performs fixed burst length
[   11.317166] random: alsactl: uninitialized urandom read (4 bytes read)
[   11.318611] starfive-eth-plat 16040000.ethernet eth1: No Safety Features support found
[   11.318627] starfive-eth-plat 16040000.ethernet eth1: IEEE 1588-2008 Advanced Timestamp supported
[   11.342098] starfive-eth-plat 16040000.ethernet eth1: configuring for phy/rgmii-id link mode
[   11.354455] starfive-eth-plat 16040000.ethernet eth1: Link is Up - 100Mbps/Full - flow control off
[   11.390090] random: lightdm: uninitialized urandom read (16 bytes read)
[   11.466281] random: alsactl: uninitialized urandom read (4 bytes read)
[   11.690727] random: crng init done
[   11.751752] vs_gem_dumb_create size = 1000
[   11.755914] Allocated coherent memory, vaddr: 0xFFFFFFE0FECC0770, paddr: 0x104A22000
[   11.763726] ====> vs_gem_alloc_buf, 162.vs_obj->get_pages = 0
[   12.215873] PVR_K:  400: RGX Firmware image 'rgx.fw.36.50.54.182' loaded
[   12.301315] PVR_K:  400: Shader binary image 'rgx.sh.36.50.54.182' loaded
[   12.310620] PVR_K:  400: X connected - (devID = 0)
[   12.584825] vs_gem_dumb_create size = 7e9000
[   12.589720] Allocated coherent memory, vaddr: 0xFFFFFFE0FCFC4000, paddr: 0x80200000
[   12.597405] ====> vs_gem_alloc_buf, 162.vs_obj->get_pages = 0
[   12.636677] vs_gem_dumb_create size = 4000
[   12.640929] Allocated coherent memory, vaddr: 0xFFFFFFE0FCFC09C0, paddr: 0x80108000
[   12.648586] ====> vs_gem_alloc_buf, 162.vs_obj->get_pages = 0
[   12.654353] vs_gem_dumb_create size = 4000
[   12.658532] Allocated coherent memory, vaddr: 0xFFFFFFE0FCFC0AA0, paddr: 0x8010C000
[   12.666205] ====> vs_gem_alloc_buf, 162.vs_obj->get_pages = 0
[   13.571720] innohdmi-starfive 29590000.hdmi: inno_hdmi_phy_clk_set_rate rate 148500000 tmdsclk 148500000
[   13.581331] innohdmi-starfive 29590000.hdmi: inno_hdmi_phy_clk_set_rate hdmi->pre_cfg->pixclock = 148500000
[   13.591104] innohdmi-starfive 29590000.hdmi: inno_hdmi_phy_clk_set_rate hdmi->pre_cfg->tmdsclock = 148500000
[   13.600948] innohdmi-starfive 29590000.hdmi: inno_hdmi_phy_clk_set_rate hdmi->pre_cfg->prediv = 1
[   13.609815] innohdmi-starfive 29590000.hdmi: inno_hdmi_phy_clk_set_rate hdmi->pre_cfg->fbdiv = 99
[   13.618695] innohdmi-starfive 29590000.hdmi: inno_hdmi_phy_clk_set_rate hdmi->pre_cfg->tmds_div_a = 1
[   13.627924] innohdmi-starfive 29590000.hdmi: inno_hdmi_phy_clk_set_rate hdmi->pre_cfg->tmds_div_b = 1
[   13.637149] innohdmi-starfive 29590000.hdmi: inno_hdmi_phy_clk_set_rate hdmi->pre_cfg->tmds_div_c = 1
[   13.646377] innohdmi-starfive 29590000.hdmi: inno_hdmi_phy_clk_set_rate hdmi->pre_cfg->pclk_div_a = 1
[   13.655604] innohdmi-starfive 29590000.hdmi: inno_hdmi_phy_clk_set_rate hdmi->pre_cfg->pclk_div_b = 2
[   13.664832] innohdmi-starfive 29590000.hdmi: inno_hdmi_phy_clk_set_rate hdmi->pre_cfg->pclk_div_c = 2
[   13.674060] innohdmi-starfive 29590000.hdmi: inno_hdmi_phy_clk_set_rate hdmi->pre_cfg->pclk_div_d = 2
[   13.683288] innohdmi-starfive 29590000.hdmi: inno_hdmi_phy_clk_set_rate hdmi->pre_cfg->vco_div_5_en = 0
[   13.692697] innohdmi-starfive 29590000.hdmi: inno_hdmi_phy_clk_set_rate hdmi->pre_cfg->fracdiv = 0
[   13.701671] innohdmi-starfive 29590000.hdmi: *******************************************************
[   13.710813] innohdmi-starfive 29590000.hdmi: inno_hdmi_phy_clk_set_rate hdmi->post_cfg->tmdsclock = 148500000
[   13.720734] innohdmi-starfive 29590000.hdmi: inno_hdmi_phy_clk_set_rate hdmi->post_cfg->prediv = 1
[   13.729693] innohdmi-starfive 29590000.hdmi: inno_hdmi_phy_clk_set_rate hdmi->post_cfg->fbdiv = 20
[   13.738665] innohdmi-starfive 29590000.hdmi: inno_hdmi_phy_clk_set_rate hdmi->post_cfg->postdiv = 1
[   13.747726] innohdmi-starfive 29590000.hdmi: inno_hdmi_phy_clk_set_rate hdmi->post_cfg->post_div_en = 3
[   13.757134] innohdmi-starfive 29590000.hdmi: inno_hdmi_phy_clk_set_rate hdmi->post_cfg->version = 3
root@starfive:~#
なお、 https://debian.starfivetech.com/ から入手するDebian以外に、 StarFiveTech VisionFive2 SDK から入手できる sdcard.img というものもあります。
起動してみるとBuildrootのLinuxとして起動
Starting DHCP server: FAIL

Welcome to Buildroot
buildroot login: root
Password:
# uname -a
Linux buildroot 5.15.0 #1 SMP Sun Dec 25 20:59:22 CST 2022 riscv64 GNU/Linux
# apt
-sh: apt: not found
# df
Filesystem           1K-blocks      Used Available Use% Mounted on
devtmpfs          `    1669016         0   1669016   0% /dev
tmpfs          `  `    1993648      `  0  `1993648   0% /dev/shm
tmpfs          `  ``   1993648        64   1993584   0% /tmp
tmpfs          `  `   `1993648       196   1993452   0% /run
/dev/mmcblk1p4      ` ` 69346    245002    194648  56% /
#
まあ、パッケージ管理システムがないので、実用には向かない感じですかね
# dmesg
[    0.000000] Linux version 5.15.0 (jenkins@soft05) (riscv64-buildroot-linux-gnu-gcc.br_real (Buildroot VF2_v2.5.0) 10.3.0, GNU ld (GNU Binutils) 2.36.1) #1 SMP Sun Dec 25 20:59:22 CST 2022
[    0.000000] OF: fdt: Ignoring memory range 0x40000000 - 0x40200000
[    0.000000] Machine model: StarFive VisionFive V2
[    0.000000] earlycon: sbi0 at I/O port 0x0 (options '')
[    0.000000] printk: bootconsole [sbi0] enabled
[    0.000000] efi: UEFI not found.
[    0.000000] Reserved memory: created CMA memory pool at 0x0000000080000000, size 512 MiB
[    0.000000] OF: reserved mem: initialized node linux,cma, compatible id shared-dma-pool
[    0.000000] Zone ranges:
[    0.000000]   DMA32    [mem 0x0000000040200000-0x00000000ffffffff]
[    0.000000]   Normal   [mem 0x0000000100000000-0x000000013fffffff]
[    0.000000] Movable zone start for each node
[    0.000000] Early memory node ranges
[    0.000000]   node   0: [mem 0x0000000040200000-0x00000000c010ffff]
[    0.000000]   node   0: [mem 0x00000000c0110000-0x00000000c01fffff]
[    0.000000]   node   0: [mem 0x00000000c0200000-0x000000013fffffff]
[    0.000000] Initmem setup node 0 [mem 0x0000000040200000-0x000000013fffffff]
[    0.000000] SBI specification v0.3 detected
[    0.000000] SBI implementation ID=0x1 Version=0x10000
[    0.000000] SBI TIME extension detected
[    0.000000] SBI IPI extension detected
[    0.000000] SBI RFENCE extension detected
[    0.000000] SBI v0.2 HSM extension detected
[    0.000000] CPU with hartid=0 is not available
[    0.000000] CPU with hartid=0 is not available
[    0.000000] riscv: ISA extensions acdfim
[    0.000000] riscv: ELF capabilities acdfim
[    0.000000] percpu: Embedded 17 pages/cpu s31528 r8192 d29912 u69632
[    0.000000] pcpu-alloc: s31528 r8192 d29912 u69632 alloc=17*4096
[    0.000000] pcpu-alloc: [0] 0 [0] 1 [0] 2 [0] 3
[    0.000000] Built 1 zonelists, mobility grouping on.  Total pages: 1033735
[    0.000000] Kernel command line: earlyprintk console=ttyS0,115200 debug rootwait earlycon=sbi root=/dev/mmcblk1p4
[    0.000000] Unknown command line parameters: earlyprintk
[    0.000000] Dentry cache hash table entries: 524288 (order: 10, 4194304 bytes, linear)
[    0.000000] Inode-cache hash table entries: 262144 (order: 9, 2097152 bytes, linear)
[    0.000000] mem auto-init: stack:off, heap alloc:off, heap free:off
[    0.000000] software IO TLB: mapped [mem 0x00000000fbfff000-0x00000000fffff000] (64MB)
[    0.000000] Memory: 3338036K/4192256K available (9878K kernel code, 4982K rwdata, 4096K rodata, 2191K init, 401K bss, 329932K reserved, 524288K cma-reserved)
[    0.000000] SLUB: HWalign=64, Order=0-3, MinObjects=0, CPUs=4, Nodes=1
[    0.000000] rcu: Hierarchical RCU implementation.
[    0.000000] rcu:     RCU restricting CPUs from NR_CPUS=8 to nr_cpu_ids=4.
[    0.000000] rcu:     RCU debug extended QS entry/exit.
[    0.000000]  Tracing variant of Tasks RCU enabled.
[    0.000000] rcu: RCU calculated value of scheduler-enlistment delay is 10 jiffies.
[    0.000000] rcu: Adjusting geometry for rcu_fanout_leaf=16, nr_cpu_ids=4
[    0.000000] NR_IRQS: 64, nr_irqs: 64, preallocated irqs: 0
[    0.000000] CPU with hartid=0 is not available
[    0.000000] riscv-intc: unable to find hart id for /cpus/cpu@0/interrupt-controller
[    0.000000] riscv-intc: 64 local interrupts mapped
[    0.000000] plic: plic@c000000: mapped 136 interrupts with 4 handlers for 9 contexts.
[    0.000000] random: get_random_bytes called from start_kernel+0x4d0/0x6e2 with crng_init=0
[    0.000000] riscv_timer_init_dt: Registering clocksource cpuid [0] hartid [3]
[    0.000000] clocksource: riscv_clocksource: mask: 0xffffffffffffffff max_cycles: 0x1d854df40, max_idle_ns: 881590404240 ns
[    0.000001] sched_clock: 64 bits at 4MHz, resolution 250ns, wraps every 2199023255500ns
[    0.008207] clocksource: timer@13050000.ch0: mask: 0xffffffff max_cycles: 0xffffffff, max_idle_ns: 79635851949 ns
[    0.018416] clocksource: timer@13050000.ch1: mask: 0xffffffff max_cycles: 0xffffffff, max_idle_ns: 79635851949 ns
[    0.028737] clocksource: timer@13050000.ch2: mask: 0xffffffff max_cycles: 0xffffffff, max_idle_ns: 79635851949 ns
[    0.039044] clocksource: timer@13050000.ch3: mask: 0xffffffff max_cycles: 0xffffffff, max_idle_ns: 79635851949 ns
[    0.049493] Console: colour dummy device 80x25
[    0.053893] Calibrating delay loop (skipped), value calculated using timer frequency.. 8.00 BogoMIPS (lpj=40000)
[    0.064089] pid_max: default: 32768 minimum: 301
[    0.068920] Mount-cache hash table entries: 8192 (order: 4, 65536 bytes, linear)
[    0.076318] Mountpoint-cache hash table entries: 8192 (order: 4, 65536 bytes, linear)
[    0.085379] ASID allocator disabled
[    0.088882] rcu: Hierarchical SRCU implementation.
[    0.093794] EFI services will not be available.
[    0.098582] smp: Bringing up secondary CPUs ...
[    0.104458] smp: Brought up 1 node, 4 CPUs
[    0.109521] devtmpfs: initialized
[    0.118784] clocksource: jiffies: mask: 0xffffffff max_cycles: 0xffffffff, max_idle_ns: 19112604462750000 ns
[    0.128559] futex hash table entries: 1024 (order: 4, 65536 bytes, linear)
[    0.148220] pinctrl core: initialized pinctrl subsystem
[    0.154189] NET: Registered PF_NETLINK/PF_ROUTE protocol family
[    0.160600] cpuidle: using governor menu
[    0.181977] platform soc:dsi-output: Fixing up cyclic dependency with 29400000.dc8200
[    0.190170] platform 295d0000.mipi: Fixing up cyclic dependency with soc:dsi-output
[    0.198067] platform 29590000.hdmi: Fixing up cyclic dependency with 29400000.dc8200
[    0.215374] HugeTLB registered 1.00 GiB page size, pre-allocated 0 pages
[    0.222021] HugeTLB registered 2.00 MiB page size, pre-allocated 0 pages
[    0.231460] vgaarb: loaded
[    0.234304] SCSI subsystem initialized
[    0.238091] libata version 3.00 loaded.
[    0.242011] usbcore: registered new interface driver usbfs
[    0.247462] usbcore: registered new interface driver hub
[    0.252810] usbcore: registered new device driver usb
[    0.258230] mc: Linux media interface: v0.10
[    0.262431] videodev: Linux video capture interface: v2.00
[    0.268126] Advanced Linux Sound Architecture Driver Initialized.
[    0.274452] Bluetooth: Core ver 2.22
[    0.277965] NET: Registered PF_BLUETOOTH protocol family
[    0.283315] Bluetooth: HCI device and connection manager initialized
[    0.289740] Bluetooth: HCI socket layer initialized
[    0.294672] Bluetooth: L2CAP socket layer initialized
[    0.299800] Bluetooth: SCO socket layer initialized
[    0.304985] clocksource: Switched to clocksource riscv_clocksource
[    0.316941] NET: Registered PF_INET protocol family
[    0.322381] IP idents hash table entries: 65536 (order: 7, 524288 bytes, linear)
[    0.332924] tcp_listen_portaddr_hash hash table entries: 2048 (order: 4, 81920 bytes, linear)
[    0.341481] TCP established hash table entries: 32768 (order: 6, 262144 bytes, linear)
[    0.349724] TCP bind hash table entries: 32768 (order: 8, 1048576 bytes, linear)
[    0.358126] TCP: Hash tables configured (established 32768 bind 32768)
[    0.364831] UDP hash table entries: 2048 (order: 5, 196608 bytes, linear)
[    0.371792] UDP-Lite hash table entries: 2048 (order: 5, 196608 bytes, linear)
[    0.379358] NET: Registered PF_UNIX/PF_LOCAL protocol family
[    0.385460] RPC: Registered named UNIX socket transport module.
[    0.391302] RPC: Registered udp transport module.
[    0.396086] RPC: Registered tcp transport module.
[    0.400834] RPC: Registered tcp NFSv4.1 backchannel transport module.
[    0.407928] PCI: CLS 0 bytes, default 64
[    0.412310] Initialise system trusted keyrings
[    0.416845] workingset: timestamp_bits=62 max_order=20 bucket_order=0
[    0.417043] Unpacking initramfs...
[    0.428050] NFS: Registering the id_resolver key type
[    0.433040] Key type id_resolver registered
[    0.437306] Key type id_legacy registered
[    0.441427] nfs4filelayout_init: NFSv4 File Layout Driver Registering...
[    0.448133] nfs4flexfilelayout_init: NFSv4 Flexfile Layout Driver Registering...
[    0.455616] ntfs: driver 2.1.32 [Flags: R/W].
[    0.460206] jffs2: version 2.2. (NAND) \xc2\xa9 2001-2006 Red Hat, Inc.
[    0.466609] fuse: init (API version 7.34)
[    0.502722] NET: Registered PF_ALG protocol family
[    0.507481] Key type asymmetric registered
[    0.511608] Asymmetric key parser 'x509' registered
[    0.516645] Block layer SCSI generic (bsg) driver version 0.4 loaded (major 249)
[    0.524002] io scheduler mq-deadline registered
[    0.528621] io scheduler kyber registered
[    0.533253] start plist test
[    0.538623] end plist test
[    0.621657] clk-starfive-jh7110 13020000.clock-controller: starfive JH7110 clkgen init successfully.
[    0.631893] L2CACHE: DataError @ 0x00000000.080400F8
[    0.636868] L2CACHE: DataFail @ 0x00000000.0804005B
[    0.641801] L2CACHE: No. of Banks in the cache: 8
[    0.646512] L2CACHE: No. of ways per bank: 16
[    0.650916] L2CACHE: Sets per bank: 256
[    0.654816] L2CACHE: Bytes per cache block: 64
[    0.659342] L2CACHE: Index of the largest way enabled: 15
[    0.665131] jh7110-pmu 17030000.power-controller: registered 8 power domains
[    0.733104] Serial: 8250/16550 driver, 6 ports, IRQ sharing disabled
[    0.742249] @@#########################@@
[    0.784445] @@ dev ptr:ffffffe0bfee0000/1500/1
[    0.789085] PVR_K:  1: Read BVNC 36.50.54.182 from HW device registers
[    0.795622] PVR_K:  1: RGX Device registered BVNC 36.50.54.182 with 1 core in the system
[    0.804932] [drm] Initialized pvr 1.17.6210866 20170530 for 18000000.gpu on minor 0
[    0.821652] loop: module loaded
[    0.827242] spi-nor spi0.0: gd25lq128d (16384 Kbytes)
[    6.163101] Initramfs unpacking failed: invalid magic at start of compressed archive
[    6.335156] Freeing initrd memory: 122788K
[    6.350721] 3 fixed-partitions partitions found on MTD device 13010000.spi.0
[    6.357746] Creating 3 MTD partitions on "13010000.spi.0":
[    6.363263] 0x000000000000-0x000000020000 : "spl"
[    6.369876] 0x000000100000-0x000000400000 : "uboot"
[    6.376294] 0x000000f00000-0x000001000000 : "data"
[    6.383678] libphy: Fixed MDIO Bus: probed
[    6.389233] CAN device driver interface
[    6.393580] starfive-eth-plat 16030000.ethernet: force_sf_dma_mode is ignored if force_thresh_dma_mode is set.
[    6.403898] starfive-eth-plat 16030000.ethernet: User ID: 0x41, Synopsys ID: 0x52
[    6.411332] starfive-eth-plat 16030000.ethernet:     DWMAC4/5
[    6.416867] starfive-eth-plat 16030000.ethernet: DMA HW capability register supported
[    6.424738] starfive-eth-plat 16030000.ethernet: RX Checksum Offload Engine supported
[    6.432635] starfive-eth-plat 16030000.ethernet: Wake-Up On Lan supported
[    6.439481] starfive-eth-plat 16030000.ethernet: TSO supported
[    6.445375] starfive-eth-plat 16030000.ethernet: Enable RX Mitigation via HW Watchdog Timer
[    6.453773] starfive-eth-plat 16030000.ethernet: Enabled Flow TC (entries=1)
[    6.460890] starfive-eth-plat 16030000.ethernet: TSO feature enabled
[    6.467302] starfive-eth-plat 16030000.ethernet: Using 40 bits DMA width
[    6.716361] libphy: stmmac: probed
[    6.719701] YT8531 Gigabit Ethernet stmmac-0:00: attached PHY driver (mii_bus:phy_addr=stmmac-0:00, irq=POLL)
[    6.729693] YT8531 Gigabit Ethernet stmmac-0:01: attached PHY driver (mii_bus:phy_addr=stmmac-0:01, irq=POLL)
[    6.740838] starfive-eth-plat 16040000.ethernet: force_sf_dma_mode is ignored if force_thresh_dma_mode is set.
[    6.751143] starfive-eth-plat 16040000.ethernet: User ID: 0x41, Synopsys ID: 0x52
[    6.758574] starfive-eth-plat 16040000.ethernet:     DWMAC4/5
[    6.764097] starfive-eth-plat 16040000.ethernet: DMA HW capability register supported
[    6.771996] starfive-eth-plat 16040000.ethernet: RX Checksum Offload Engine supported
[    6.779881] starfive-eth-plat 16040000.ethernet: Wake-Up On Lan supported
[    6.786728] starfive-eth-plat 16040000.ethernet: TSO supported
[    6.792608] starfive-eth-plat 16040000.ethernet: Enable RX Mitigation via HW Watchdog Timer
[    6.801034] starfive-eth-plat 16040000.ethernet: Enabled Flow TC (entries=1)
[    6.808137] starfive-eth-plat 16040000.ethernet: TSO feature enabled
[    6.814536] starfive-eth-plat 16040000.ethernet: Using 40 bits DMA width
[    7.062390] libphy: stmmac: probed
[    7.065758] YT8512B Ethernet stmmac-1:00: attached PHY driver (mii_bus:phy_addr=stmmac-1:00, irq=POLL)
[    7.075101] YT8512B Ethernet stmmac-1:03: attached PHY driver (mii_bus:phy_addr=stmmac-1:03, irq=POLL)
[    7.085971] Intel(R) Wireless WiFi driver for Linux
[    7.092653] cdns3-starfive 10210000.usbdrd: usb mode 2 2.0 probe success
[    7.100068] usbcore: registered new interface driver uas
[    7.105381] usbcore: registered new interface driver usb-storage
[    7.125324] starfive-rtc 17040000.rtc: registered as rtc0
[    7.130661] starfive-rtc 17040000.rtc: setting system clock to 2001-01-01T00:00:00 UTC (978307200)
[    7.139816] i2c_dev: i2c /dev entries driver
[    7.144258] usbcore: registered new interface driver uvcvideo
[    7.151107] starfive-wdt 13070000.wdog: Heartbeat: timeout=15, count/2=180000000 (0aba9500)
[    7.159926] Bluetooth: HCI UART driver ver 2.3
[    7.164299] Bluetooth: HCI UART protocol H4 registered
[    7.169730] starfive-cpufreq soc:starfive,jh7110-cpufreq: Failed to get regulator for cpu!
[    7.177948] starfive-cpufreq soc:starfive,jh7110-cpufreq: Failed to init starfive cpu dvfs info
[    7.187226] sdhci: Secure Digital Host Controller Interface driver
[    7.193340] sdhci: Copyright(c) Pierre Ossman
[    7.197808] Synopsys Designware Multimedia Card Interface Driver
[    7.204133] sdhci-pltfm: SDHCI platform and OF driver helper
[    7.210534] jh7110-sec 16000000.crypto: Unable to request sec_m dma channel in DMA channel
[    7.218766] jh7110-sec 16000000.crypto: Cannot initial dma chan
[    7.225021] usbcore: registered new interface driver usbhid
[    7.230525] usbhid: USB HID core driver
[    7.234668] usbcore: registered new interface driver snd-usb-audio
[    7.244078] NET: Registered PF_PACKET protocol family
[    7.249105] can: controller area network core
[    7.253577] NET: Registered PF_CAN protocol family
[    7.258352] can: raw protocol
[    7.261374] can: broadcast manager protocol
[    7.265654] can: netlink gateway - max_hops=1
[    7.270319] Bluetooth: RFCOMM TTY layer initialized
[    7.275156] Bluetooth: RFCOMM socket layer initialized
[    7.280348] Bluetooth: RFCOMM ver 1.11
[    7.284174] Bluetooth: BNEP (Ethernet Emulation) ver 1.3
[    7.289527] Bluetooth: BNEP filters: protocol multicast
[    7.294807] Bluetooth: BNEP socket layer initialized
[    7.300037] 9pnet: Installing 9P2000 support
[    7.304298] Key type dns_resolver registered
[    7.309315] Loading compiled-in X.509 certificates
[    7.349770] starfive_jh7110-pinctrl 13040000.gpio: SiFive GPIO chip registered 64 GPIOs
[    7.358542] starfive_jh7110-pinctrl 17020000.gpio: SiFive GPIO chip registered 4 GPIOs
[    7.366630] pl08xdmac 16008000.sec_dma: initialized 8 virtual memcpy channels
[    7.373710] pl08xdmac 16008000.sec_dma: initialized 16 virtual slave channels
[    7.382563] debugfs: Directory '16008000.sec_dma' with parent 'dmaengine' already present!
[    7.390808] pl08xdmac 16008000.sec_dma: DMA: PL080 rev0 at 0x16008000 irq 23
[    7.398152] ssp-pl022 10060000.spi: ARM PL022 driver for StarFive SoC platform, device ID: 0x00041022
[    7.407335] ssp-pl022 10060000.spi: mapped registers from 0x0000000010060000 to (____ptrval____)
[    7.416616] ssp-pl022 10060000.spi: Requested frequency: 10000000 Hz is unsupported,select by default 8250000 Hz
[    7.427123] ssp-pl022 10060000.spi: will use autosuspend for runtime pm, delay 100ms
[    7.436132] i2c 2-0045: Fixing up cyclic dependency with 295d0000.mipi
[    7.442852] seeed_panel 2-0045: Unknown Atmel firmware revision: 0x00
[    7.449451] i2c 2-0019: Fixing up cyclic dependency with 295d0000.mipi
[    7.457354] at24 5-0050: supply vcc not found, using dummy regulator
[    7.464420] at24 5-0050: 512 byte 24c04 EEPROM, writable, 16 bytes/write
[    7.472982] axp15060-regulator 5-0036: Register mipi_0p9 done! vol range:900 ~ 900 mV
[    7.482264] axp15060-regulator 5-0036: Register hdmi_1p8 done! vol range:1800 ~ 1800 mV
[    7.491702] axp15060-regulator 5-0036: Register hdmi_0p9 done! vol range:900 ~ 900 mV
[    7.500980] axp15060-regulator 5-0036: Register cpu_vdd done! vol range:500 ~ 1540 mV
[    7.509530] i2c 6-0010: Fixing up cyclic dependency with 19800000.vin_sysctl
[    7.516925] imx219 6-0010: supply VANA not found, using dummy regulator
[    7.523594] imx219 6-0010: supply VDIG not found, using dummy regulator
[    7.530237] imx219 6-0010: supply VDDL not found, using dummy regulator
[    7.544306] imx219 6-0010: failed to read chip id 219
[    7.549516] imx219: probe of 6-0010 failed with error -5
[    7.557305] pcie_plda 2b000000.pcie: host bridge /soc/pcie@2B000000 ranges:
[    7.564244] pcie_plda 2b000000.pcie:      MEM 0x0030000000..0x0037ffffff -> 0x0030000000
[    7.572409] pcie_plda 2b000000.pcie:      MEM 0x0900000000..0x093fffffff -> 0x0900000000
[    7.580567] ATR entry: 0x0940000000 -> 0x0000000000 [0x0010000000] (param: 0x000001)
[    7.588333] ATR entry: 0x0030000000 -> 0x0030000000 [0x0008000000] (param: 0x000000)
[    7.596119] ATR entry: 0x0900000000 -> 0x0900000000 [0x0040000000] (param: 0x000000)
[    7.945086] pcie_plda 2b000000.pcie: Port link up.
[    7.949963] pcie_plda 2b000000.pcie: PCI host bridge to bus 0000:00
[    7.956182] pci_bus 0000:00: root bus resource [bus 00-ff]
[    7.961705] pci_bus 0000:00: root bus resource [mem 0x30000000-0x37ffffff]
[    7.968653] pci_bus 0000:00: root bus resource [mem 0x900000000-0x93fffffff pref]
[    7.976220] pci 0000:00:00.0: [1556:1111] type 01 class 0x060400
[    7.982255] pci 0000:00:00.0: reg 0x10: [mem 0x00000000-0xffffffff 64bit pref]
[    7.989597] pci 0000:00:00.0: supports D1 D2
[    7.993858] pci 0000:00:00.0: PME# supported from D0 D1 D2 D3hot D3cold
[    8.004020] pci 0000:00:00.0: bridge configuration invalid ([bus 00-00]), reconfiguring
[    8.012105] pci 0000:01:00.0: [1106:3483] type 00 class 0x0c0330
[    8.018068] pci 0000:01:00.0: reg 0x10: [mem 0x00000000-0x00000fff 64bit]
[    8.024966] pci 0000:01:00.0: PME# supported from D0 D3cold
[    8.033819] pci_bus 0000:01: busn_res: [bus 01-ff] end is updated to 01
[    8.040414] pci 0000:00:00.0: BAR 0: no space for [mem size 0x100000000 64bit pref]
[    8.048093] pci 0000:00:00.0: BAR 0: failed to assign [mem size 0x100000000 64bit pref]
[    8.056154] pci 0000:00:00.0: BAR 8: assigned [mem 0x30000000-0x300fffff]
[    8.062990] pci 0000:01:00.0: BAR 0: assigned [mem 0x30000000-0x30000fff 64bit]
[    8.070377] pci 0000:00:00.0: PCI bridge to [bus 01]
[    8.075394] pci 0000:00:00.0:   bridge window [mem 0x30000000-0x300fffff]
[    8.082330] pci 0000:00:00.0: enabling device (0000 -> 0002)
[    8.087968] pci 0000:01:00.0: enabling device (0000 -> 0002)
[    8.093697] pci 0000:01:00.0: quirk_usb_early_handoff+0x0/0x9d4 took 11109 usecs
[    8.101345] xhci_hcd 0000:01:00.0: xHCI Host Controller
[    8.106537] xhci_hcd 0000:01:00.0: new USB bus registered, assigned bus number 1
[    8.114362] xhci_hcd 0000:01:00.0: hcc params 0x002841eb hci version 0x100 quirks 0x0000040000000890
[    8.123534] pcie_plda 2b000000.pcie: msi#0 address_hi 0x0 address_lo 0x190
[    8.130747] xhci_hcd 0000:01:00.0: xHCI Host Controller
[    8.135929] xhci_hcd 0000:01:00.0: new USB bus registered, assigned bus number 2
[    8.143361] xhci_hcd 0000:01:00.0: Host supports USB 3.0 SuperSpeed
[    8.150455] hub 1-0:1.0: USB hub found
[    8.154164] hub 1-0:1.0: 1 port detected
[    8.159175] hub 2-0:1.0: USB hub found
[    8.162884] hub 2-0:1.0: 4 ports detected
[    8.169690] pcie_plda 2c000000.pcie: host bridge /soc/pcie@2C000000 ranges:
[    8.176646] pcie_plda 2c000000.pcie:      MEM 0x0038000000..0x003fffffff -> 0x0038000000
[    8.184755] pcie_plda 2c000000.pcie:      MEM 0x0980000000..0x09bfffffff -> 0x0980000000
[    8.192956] ATR entry: 0x09c0000000 -> 0x0000000000 [0x0010000000] (param: 0x000001)
[    8.200713] ATR entry: 0x0038000000 -> 0x0038000000 [0x0008000000] (param: 0x000000)
[    8.208504] ATR entry: 0x0980000000 -> 0x0980000000 [0x0040000000] (param: 0x000000)
[    8.375033] usb usb2-port2: over-current condition
[    8.475048] usb 1-1: new high-speed USB device number 2 using xhci_hcd
[    8.535067] usb usb2-port4: over-current condition
[    8.645256] pcie_plda 2c000000.pcie: Port link down, exit.
[    8.664394] clk-starfive-jh7110-vout 295c0000.clock-controller: starfive JH7110 clk_vout init successfully.
[    8.666191] hub 1-1:1.0: USB hub found
[    8.683633] hub 1-1:1.0: 4 ports detected
[    8.685694] clk-starfive-jh7110-isp 19810000.clock-controller: starfive JH7110 clk_isp init successfully.
[    8.697845] dw_axi_dmac_platform 16050000.dma-controller: DesignWare AXI DMA Controller, 4 channels
[    8.707898] printk: console [ttyS0] disabled
[    8.732341] 10000000.serial: ttyS0 at MMIO 0x10000000 (irq = 17, base_baud = 1500000) is a 16550A
[    8.741251] printk: console [ttyS0] enabled
[    8.749550] printk: bootconsole [sbi0] disabled
[    8.759171] jh7110-vin 19800000.vin_sysctl: stfcamss probe enter!
[    8.767285] jh7110-vin 19800000.vin_sysctl: stfcamss probe success!
[    8.776062] dwmmc_starfive 16010000.sdio0: IDMAC supports 32-bit address mode.
[    8.776520] dwmmc_starfive 16020000.sdio1: IDMAC supports 32-bit address mode.
[    8.783348] dwmmc_starfive 16010000.sdio0: Using internal DMA controller.
[    8.790619] dwmmc_starfive 16020000.sdio1: Using internal DMA controller.
[    8.797391] dwmmc_starfive 16010000.sdio0: Version ID is 290a
[    8.804178] dwmmc_starfive 16020000.sdio1: Version ID is 290a
[    8.809968] dwmmc_starfive 16010000.sdio0: DW MMC controller at irq 29,32 bit host data width,32 deep fifo
[    8.810081] jh7110-sec 16000000.crypto: will run requests pump with realtime priority
[    8.813252] jh7110-sec 16000000.crypto: Initialized
[    8.814330] starfive-i2s 120b0000.i2stx_4ch0:  designware: play supported
[    8.814340] starfive-i2s 120b0000.i2stx_4ch0: designware: i2s master mode supported
[    8.814517] sf-mipi-dphy-tx 295e0000.mipi-dphy: sf_dphy_probe begin
[    8.814530] sf-mipi-dphy-tx 295e0000.mipi-dphy: ===> sf_dphy_probe enter, 445
[    8.814656] sf-mipi-dphy-tx 295e0000.mipi-dphy: control ECO
[    8.814676] sf-mipi-dphy-tx 295e0000.mipi-dphy: supply mipi_1p8 not found, using dummy regulator
[    8.814961] sf-mipi-dphy-tx 295e0000.mipi-dphy: sf_dphy_probe end
[    8.815177] cdns-dsi 295d0000.mipi: dsi_sys_clk = 297000000
[    8.815414] cdns-dsi 295d0000.mipi: starfive dsi bind end
[    8.815749] dwmmc_starfive 16020000.sdio1: DW MMC controller at irq 30,32 bit host data width,32 deep fifo
[    8.817635] of_cfs_init
[    8.817676] of_cfs_init: OK
[    8.818197] starfive-pwmdac 100b0000.pwmdac: clk_apb0 = 49500000, clk_pwmdac_apb = 49500000, clk_pwmdac_core = 4068493
[    8.818696] cfg80211: Loading compiled-in X.509 certificates for regulatory database
[    8.825533] mmc_host mmc0: card is non-removable.
[    8.833373] mmc_host mmc1: card is polling.
[    8.929459] cfg80211: Loaded X.509 cert 'sforshee: 00b28ddf47aef9cea7'
[    8.948766] starfive soc:display-subsystem: bound 29400000.dc8200 (ops 0xffffffff80e75b38)
[    8.957085] innohdmi-starfive 29590000.hdmi: inno hdmi bind begin
[    8.963977] platform regulatory.0: Direct firmware load for regulatory.db failed with error -2
[    8.972619] cfg80211: failed to load regulatory.db
[    8.972931] innohdmi-starfive 29590000.hdmi: [drm:inno_hdmi_bind] registered Inno HDMI I2C bus driver success
[    8.987563] innohdmi-starfive 29590000.hdmi: HDMI&AUDIO register done.
[    8.994127] innohdmi-starfive 29590000.hdmi: inno hdmi bind end
[    9.000087] starfive soc:display-subsystem: bound 29590000.hdmi (ops 0xffffffff80e768e8)
[    9.008196] vs-simple-encoder soc:dsi-output: encoder_bind begin
[    9.014217] no panel, -517
[    9.016930] vs-simple-encoder soc:dsi-output: encoder_bind error
[    9.022932] starfive soc:display-subsystem: bound soc:dsi-output (ops 0xffffffff80e76530)
[    9.031555] [drm] Initialized starfive 1.0.0 20191101 for soc:display-subsystem on minor 1
[    9.055005] mmc_host mmc0: Bus speed (slot 0) = 198000000Hz (slot req 400000Hz, actual 399193HZ div = 248)
[    9.145059] mmc_host mmc1: Bus speed (slot 0) = 198000000Hz (slot req 400000Hz, actual 399193HZ div = 248)
[    9.290157] random: fast init done
[    9.397446] mmc_host mmc1: Bus speed (slot 0) = 198000000Hz (slot req 50000000Hz, actual 49500000HZ div = 2)
[    9.408322] mmc1: new high speed SDXC card at address 59b4
[    9.415198] mmcblk1: mmc1:59b4 ED2S5 119 GiB
[    9.428259]  mmcblk1: p1 p2 p3 p4
[    9.505093] mmc_host mmc0: Bus speed (slot 0) = 198000000Hz (slot req 300000Hz, actual 300000HZ div = 330)
[    9.945051] mmc_host mmc0: Bus speed (slot 0) = 198000000Hz (slot req 200000Hz, actual 200000HZ div = 495)
[   10.395102] mmc_host mmc0: Bus speed (slot 0) = 198000000Hz (slot req 100000Hz, actual 100000HZ div = 990)
[   11.055070] ALSA device list:
[   11.058064]   #0: Starfive-PWMDAC-Sound-Card
[   11.062364]   #1: Starfive-HDMI-Sound-Card
[   11.071575] Freeing unused kernel image (initmem) memory: 2188K
[   11.077824] Run /init as init process
[   11.081513]   with arguments:
[   11.084498]     /init
[   11.086825]     earlyprintk
[   11.089640]   with environment:
[   11.092804]     HOME=/
[   11.095211]     TERM=linux
[   11.218169] EXT4-fs (mmcblk1p4): mounted filesystem with ordered data mode. Opts: (null). Quota mode: disabled.
[   11.784545] EXT4-fs (mmcblk1p4): re-mounted. Opts: (null). Quota mode: disabled.
[   12.264121] udevd[221]: starting version 3.2.10
[   12.280697] random: udevd: uninitialized urandom read (16 bytes read)
[   12.288433] random: udevd: uninitialized urandom read (16 bytes read)
[   12.294947] random: udevd: uninitialized urandom read (16 bytes read)
[   12.355311] udevd[222]: starting eudev-3.2.10
[   12.470759] jpu: loading out-of-tree module taints kernel.
[   12.479700] vdec 130a0000.vpu_dec: device init.
[   12.482697] cnm_jpu 13090000.jpu: init device.
[   12.484250] SUCCESS alloc_chrdev_region
[   12.484633] SUCCESS alloc_chrdev_region
[   13.172744] starfive-eth-plat 16030000.ethernet eth0: PHY [stmmac-0:00] driver [YT8531 Gigabit Ethernet] (irq=POLL)
[   13.184615] starfive-eth-plat 16030000.ethernet eth0: Register MEM_TYPE_PAGE_POOL RxQ-0
[   13.203187] dwmac4: Master AXI performs fixed burst length
[   13.208732] starfive-eth-plat 16030000.ethernet eth0: No Safety Features support found
[   13.218053] starfive-eth-plat 16030000.ethernet eth0: IEEE 1588-2008 Advanced Timestamp supported
[   13.227963] starfive-eth-plat 16030000.ethernet eth0: configuring for phy/rgmii-id link mode
[   13.238746] starfive-eth-plat 16040000.ethernet eth1: PHY [stmmac-1:00] driver [YT8512B Ethernet] (irq=POLL)
[   13.248829] starfive-eth-plat 16040000.ethernet eth1: Register MEM_TYPE_PAGE_POOL RxQ-0
[   13.257127] dwmac4: Master AXI performs fixed burst length
[   13.262625] starfive-eth-plat 16040000.ethernet eth1: No Safety Features support found
[   13.270565] starfive-eth-plat 16040000.ethernet eth1: IEEE 1588-2008 Advanced Timestamp supported
[   13.281166] starfive-eth-plat 16040000.ethernet eth1: configuring for phy/rgmii-id link mode
[   13.292204] starfive-eth-plat 16040000.ethernet eth1: Link is Up - 100Mbps/Full - flow control off
[   38.975439] mipi_0p9: disabling
[  163.455196] random: crng init done
[  163.458654] random: 7 urandom warning(s) missed due to ratelimiting
#