Proxmox VEの2サーバ+ corosync qdeviceサーバの3サーバ構成でProxmox VEクラスタを作った際に、cephを組めるのかな?と実験してみた
Proxmox VEサーバは CPU6コア、メモリ16GB、システムディスク120GBで作成し、ceph用ストレージとして16GBディスクを3個で稼働させた。
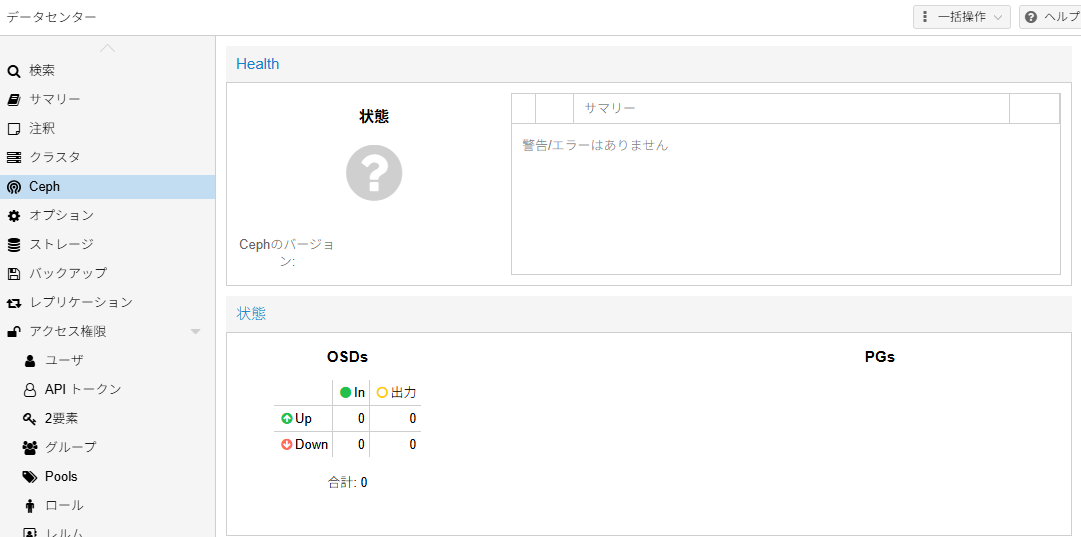
とりあえず動いてる
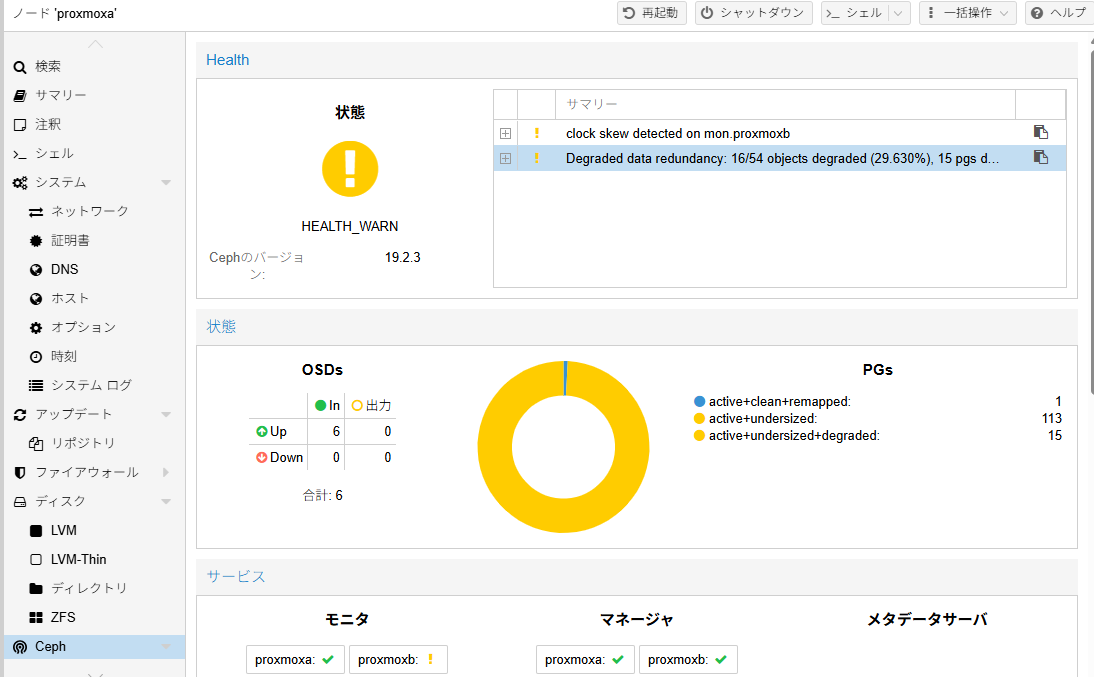

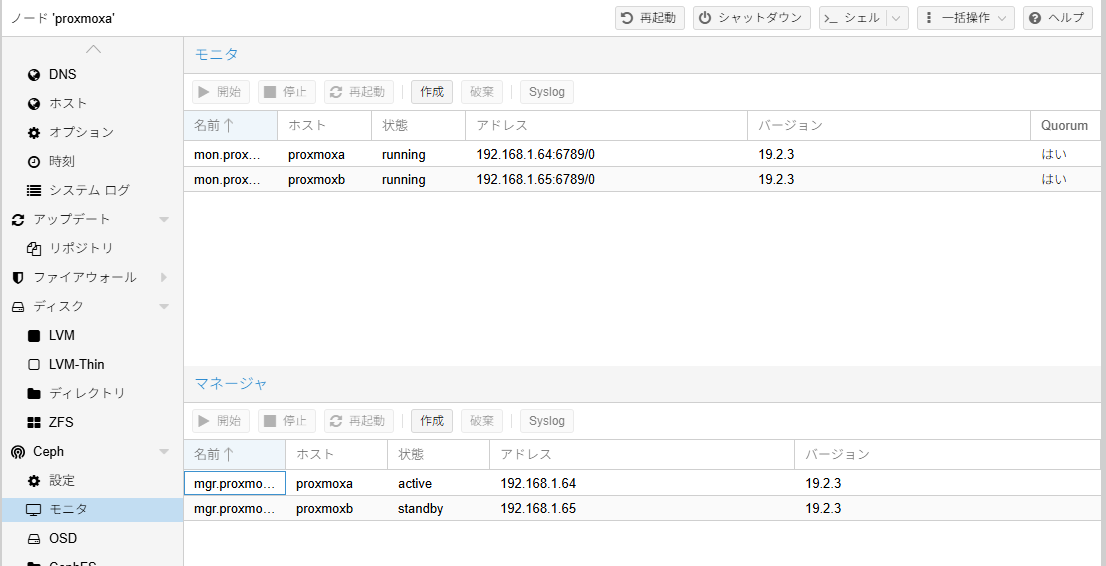
モニタとマネージャは各サーバに1個ずつ設定した。
ただ、1台止めた場合に、cephは使えなくなる状態である。
後述の2ノードに均等に同じデータを持たす設定としても、ceph環境での多数決で過半数を問えるようにするには、仮想でもいいのでもう1ノード立てないと実現できないので、どうしようかなぁ・・・という状態となっている。
とりあえずcephストレージに仮想マシンを配置した場合の動作確認には使えるので、とりあえずはこれでいいか、としているが、
実は2ノードだとデータがミラー構成になるので、確保したディスク容量の1/2以下しか使えないのに対して、3ノードであれば、1/2~2/3の間程度が使える計算となるのでそっちの構成の方が良かったかなぁ・・と思わなくもない
詳細確認
まず「ceph health」と「ceph health detail」を実行して確認
root@proxmoxa:~# ceph health
HEALTH_WARN clock skew detected on mon.proxmoxb; Degraded data redundancy: 28/90 objects degraded (31.111%), 25 pgs degraded, 128 pgs undersized
root@proxmoxa:~# ceph health detail
HEALTH_WARN clock skew detected on mon.proxmoxb; Degraded data redundancy: 39/123 objects degraded (31.707%), 35 pgs degraded, 128 pgs undersized
[WRN] MON_CLOCK_SKEW: clock skew detected on mon.proxmoxb
    mon.proxmoxb clock skew 0.305298s > max 0.05s (latency 0.00675958s)
[WRN] PG_DEGRADED: Degraded data redundancy: 39/123 objects degraded (31.707%), 35 pgs degraded, 128 pgs undersized
    pg 2.0 is stuck undersized for 26m, current state active+undersized, last acting [3,1]
    pg 2.1 is stuck undersized for 26m, current state active+undersized, last acting [2,5]
    pg 2.2 is stuck undersized for 26m, current state active+undersized, last acting [5,1]
    pg 2.3 is stuck undersized for 26m, current state active+undersized, last acting [5,2]
    pg 2.4 is stuck undersized for 26m, current state active+undersized+degraded, last acting [1,4]
    pg 2.5 is stuck undersized for 26m, current state active+undersized, last acting [3,0]
    pg 2.6 is stuck undersized for 26m, current state active+undersized, last acting [1,3]
    pg 2.7 is stuck undersized for 26m, current state active+undersized+degraded, last acting [3,2]
    pg 2.8 is stuck undersized for 26m, current state active+undersized, last acting [3,0]
    pg 2.9 is stuck undersized for 26m, current state active+undersized, last acting [1,4]
    pg 2.a is stuck undersized for 26m, current state active+undersized+degraded, last acting [1,4]
    pg 2.b is stuck undersized for 26m, current state active+undersized, last acting [3,0]
    pg 2.c is stuck undersized for 26m, current state active+undersized, last acting [2,3]
    pg 2.d is stuck undersized for 26m, current state active+undersized, last acting [1,3]
    pg 2.e is stuck undersized for 26m, current state active+undersized+degraded, last acting [2,3]
    pg 2.f is stuck undersized for 26m, current state active+undersized, last acting [4,0]
    pg 2.10 is stuck undersized for 26m, current state active+undersized, last acting [2,4]
    pg 2.11 is stuck undersized for 26m, current state active+undersized, last acting [4,1]
    pg 2.1c is stuck undersized for 26m, current state active+undersized+degraded, last acting [4,2]
    pg 2.1d is stuck undersized for 26m, current state active+undersized, last acting [3,0]
    pg 2.1e is stuck undersized for 26m, current state active+undersized+degraded, last acting [2,5]
    pg 2.1f is stuck undersized for 26m, current state active+undersized+degraded, last acting [0,3]
    pg 2.20 is stuck undersized for 26m, current state active+undersized+degraded, last acting [5,1]
    pg 2.21 is stuck undersized for 26m, current state active+undersized, last acting [2,4]
    pg 2.22 is stuck undersized for 26m, current state active+undersized, last acting [3,2]
    pg 2.23 is stuck undersized for 26m, current state active+undersized, last acting [0,3]
    pg 2.24 is stuck undersized for 26m, current state active+undersized, last acting [5,1]
    pg 2.25 is stuck undersized for 26m, current state active+undersized, last acting [4,1]
    pg 2.26 is stuck undersized for 26m, current state active+undersized, last acting [5,2]
    pg 2.27 is stuck undersized for 26m, current state active+undersized, last acting [3,0]
    pg 2.28 is stuck undersized for 26m, current state active+undersized, last acting [2,3]
    pg 2.29 is stuck undersized for 26m, current state active+undersized+degraded, last acting [3,1]
    pg 2.2a is stuck undersized for 26m, current state active+undersized, last acting [5,0]
    pg 2.2b is stuck undersized for 26m, current state active+undersized, last acting [2,4]
    pg 2.2c is stuck undersized for 26m, current state active+undersized, last acting [2,5]
    pg 2.2d is stuck undersized for 26m, current state active+undersized, last acting [5,2]
    pg 2.2e is stuck undersized for 26m, current state active+undersized+degraded, last acting [5,0]
    pg 2.2f is stuck undersized for 26m, current state active+undersized+degraded, last acting [5,0]
    pg 2.30 is stuck undersized for 26m, current state active+undersized+degraded, last acting [4,0]
    pg 2.31 is stuck undersized for 26m, current state active+undersized, last acting [0,5]
    pg 2.32 is stuck undersized for 26m, current state active+undersized, last acting [5,1]
    pg 2.33 is stuck undersized for 26m, current state active+undersized, last acting [3,1]
    pg 2.34 is stuck undersized for 26m, current state active+undersized+degraded, last acting [5,0]
    pg 2.35 is stuck undersized for 26m, current state active+undersized, last acting [1,3]
    pg 2.36 is stuck undersized for 26m, current state active+undersized, last acting [1,4]
    pg 2.37 is stuck undersized for 26m, current state active+undersized, last acting [3,1]
    pg 2.38 is stuck undersized for 26m, current state active+undersized+degraded, last acting [0,5]
    pg 2.39 is stuck undersized for 26m, current state active+undersized, last acting [1,5]
    pg 2.7d is stuck undersized for 26m, current state active+undersized, last acting [0,4]
    pg 2.7e is stuck undersized for 26m, current state active+undersized+degraded, last acting [0,4]
    pg 2.7f is stuck undersized for 26m, current state active+undersized+degraded, last acting [4,1]
root@proxmoxa:~#
続いて「ceph -s」
root@proxmoxa:~# ceph -s
  cluster:
    id:     26b59237-5bed-45fe-906e-aa3b13033b86
    health: HEALTH_WARN
            clock skew detected on mon.proxmoxb
            Degraded data redundancy: 120/366 objects degraded (32.787%), 79 pgs degraded, 128 pgs undersized

  services:
    mon: 2 daemons, quorum proxmoxa,proxmoxb (age 27m)
    mgr: proxmoxa(active, since 34m), standbys: proxmoxb
    osd: 6 osds: 6 up (since 28m), 6 in (since 29m); 1 remapped pgs

  data:
    pools:   2 pools, 129 pgs
    objects: 122 objects, 436 MiB
    usage:   1.0 GiB used, 95 GiB / 96 GiB avail
    pgs:     120/366 objects degraded (32.787%)
             2/366 objects misplaced (0.546%)
             79 active+undersized+degraded
             49 active+undersized
             1  active+clean+remapped

  io:
    client:   15 KiB/s rd, 8.4 MiB/s wr, 17 op/s rd, 13 op/s wr

root@proxmoxa:~#
clock skew detected
まずは「clock skew detected」について確認
[WRN] MON_CLOCK_SKEW: clock skew detected on mon.proxmoxb
    mon.proxmoxb clock skew 0.305298s > max 0.05s (latency 0.00675958s)
「MON_CLOCK_SKEW」にある通りサーバ間の時刻に差がある、というもの
mon_clock_drift_allowed が標準では 0.05秒で設定されているものに対して「mon.proxmoxb clock skew 0.305298s」となっているため警告となっている。
今回の検証環境はESXi 8.0 Free版の上に立てているので、全体的な処理パワーが足りずに遅延になっているのではないかと思われるため無視する
設定として無視する場合はproxmox wikiの Ceph Configuration にあるように「ceph config コマンド」で行う
現在の値を確認
root@proxmoxa:~# ceph config get mon mon_clock_drift_allowed
0.050000
root@proxmoxa:~#
設定を変更、今回は0.5ぐらいにしておくか
root@proxmoxa:~# ceph config set mon mon_clock_drift_allowed 0.5
root@proxmoxa:~# ceph config get mon mon_clock_drift_allowed
0.500000
root@proxmoxa:~#
メッセージが消えたことを確認
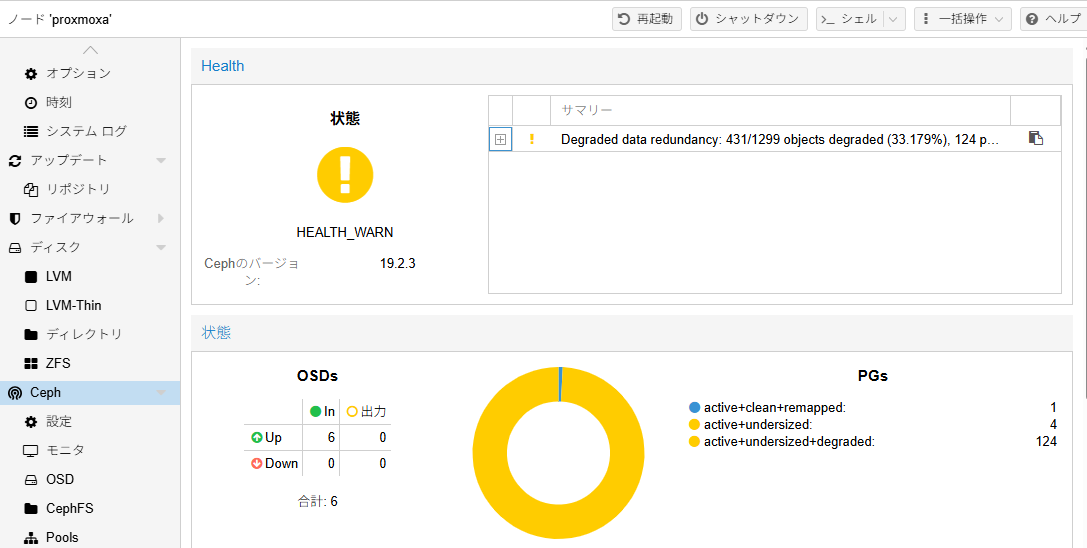
コマンドを実行しても消えていることを確認
root@proxmoxa:~# ceph -s
  cluster:
    id:     26b59237-5bed-45fe-906e-aa3b13033b86
    health: HEALTH_WARN
            Degraded data redundancy: 427/1287 objects degraded (33.178%), 124 pgs degraded, 128 pgs undersized

  services:
    mon: 2 daemons, quorum proxmoxa,proxmoxb (age 40m)
    mgr: proxmoxa(active, since 47m), standbys: proxmoxb
    osd: 6 osds: 6 up (since 41m), 6 in (since 41m); 1 remapped pgs

  data:
    pools:   2 pools, 129 pgs
    objects: 429 objects, 1.6 GiB
    usage:   3.4 GiB used, 93 GiB / 96 GiB avail
    pgs:     427/1287 objects degraded (33.178%)
             2/1287 objects misplaced (0.155%)
             124 active+undersized+degraded
             4   active+undersized
             1   active+clean+remapped

  io:
    client:   685 KiB/s rd, 39 KiB/s wr, 7 op/s rd, 2 op/s wr

root@proxmoxa:~#
ceph helth detailからも消えたことを確認
root@proxmoxa:~# ceph health
HEALTH_WARN Degraded data redundancy: 426/1284 objects degraded (33.178%), 124 pgs degraded, 128 pgs undersized
root@proxmoxa:~# ceph health detail
HEALTH_WARN Degraded data redundancy: 422/1272 objects degraded (33.176%), 124 pgs degraded, 128 pgs undersized
[WRN] PG_DEGRADED: Degraded data redundancy: 422/1272 objects degraded (33.176%), 124 pgs degraded, 128 pgs undersized
    pg 2.0 is stuck undersized for 39m, current state active+undersized+degraded, last acting [3,1]
    pg 2.1 is stuck undersized for 39m, current state active+undersized+degraded, last acting [2,5]
    pg 2.2 is stuck undersized for 39m, current state active+undersized+degraded, last acting [5,1]
    pg 2.3 is stuck undersized for 39m, current state active+undersized+degraded, last acting [5,2]
    pg 2.4 is stuck undersized for 39m, current state active+undersized+degraded, last acting [1,4]
    pg 2.5 is stuck undersized for 39m, current state active+undersized+degraded, last acting [3,0]
    pg 2.6 is stuck undersized for 39m, current state active+undersized+degraded, last acting [1,3]
    pg 2.7 is stuck undersized for 39m, current state active+undersized+degraded, last acting [3,2]
    pg 2.8 is stuck undersized for 39m, current state active+undersized+degraded, last acting [3,0]
    pg 2.9 is stuck undersized for 39m, current state active+undersized+degraded, last acting [1,4]
    pg 2.a is stuck undersized for 39m, current state active+undersized+degraded, last acting [1,4]
    pg 2.b is stuck undersized for 39m, current state active+undersized+degraded, last acting [3,0]
    pg 2.c is stuck undersized for 39m, current state active+undersized+degraded, last acting [2,3]
    pg 2.d is stuck undersized for 39m, current state active+undersized+degraded, last acting [1,3]
    pg 2.e is stuck undersized for 39m, current state active+undersized+degraded, last acting [2,3]
    pg 2.f is stuck undersized for 39m, current state active+undersized+degraded, last acting [4,0]
    pg 2.10 is stuck undersized for 39m, current state active+undersized+degraded, last acting [2,4]
    pg 2.11 is active+undersized+degraded, acting [4,1]
    pg 2.1c is stuck undersized for 39m, current state active+undersized+degraded, last acting [4,2]
    pg 2.1d is stuck undersized for 39m, current state active+undersized+degraded, last acting [3,0]
    pg 2.1e is stuck undersized for 39m, current state active+undersized+degraded, last acting [2,5]
    pg 2.1f is stuck undersized for 39m, current state active+undersized+degraded, last acting [0,3]
    pg 2.20 is stuck undersized for 39m, current state active+undersized+degraded, last acting [5,1]
    pg 2.21 is stuck undersized for 39m, current state active+undersized+degraded, last acting [2,4]
    pg 2.22 is stuck undersized for 39m, current state active+undersized+degraded, last acting [3,2]
    pg 2.23 is stuck undersized for 39m, current state active+undersized+degraded, last acting [0,3]
    pg 2.24 is stuck undersized for 39m, current state active+undersized+degraded, last acting [5,1]
    pg 2.25 is stuck undersized for 39m, current state active+undersized+degraded, last acting [4,1]
    pg 2.26 is stuck undersized for 39m, current state active+undersized+degraded, last acting [5,2]
    pg 2.27 is stuck undersized for 39m, current state active+undersized, last acting [3,0]
    pg 2.28 is stuck undersized for 39m, current state active+undersized+degraded, last acting [2,3]
    pg 2.29 is stuck undersized for 39m, current state active+undersized+degraded, last acting [3,1]
    pg 2.2a is stuck undersized for 39m, current state active+undersized+degraded, last acting [5,0]
    pg 2.2b is stuck undersized for 39m, current state active+undersized+degraded, last acting [2,4]
    pg 2.2c is stuck undersized for 39m, current state active+undersized+degraded, last acting [2,5]
    pg 2.2d is stuck undersized for 39m, current state active+undersized+degraded, last acting [5,2]
    pg 2.2e is stuck undersized for 39m, current state active+undersized+degraded, last acting [5,0]
    pg 2.2f is stuck undersized for 39m, current state active+undersized+degraded, last acting [5,0]
    pg 2.30 is stuck undersized for 39m, current state active+undersized+degraded, last acting [4,0]
    pg 2.31 is stuck undersized for 39m, current state active+undersized+degraded, last acting [0,5]
    pg 2.32 is stuck undersized for 39m, current state active+undersized+degraded, last acting [5,1]
    pg 2.33 is stuck undersized for 39m, current state active+undersized+degraded, last acting [3,1]
    pg 2.34 is stuck undersized for 39m, current state active+undersized+degraded, last acting [5,0]
    pg 2.35 is stuck undersized for 39m, current state active+undersized+degraded, last acting [1,3]
    pg 2.36 is stuck undersized for 39m, current state active+undersized+degraded, last acting [1,4]
    pg 2.37 is stuck undersized for 39m, current state active+undersized+degraded, last acting [3,1]
    pg 2.38 is stuck undersized for 39m, current state active+undersized+degraded, last acting [0,5]
    pg 2.39 is stuck undersized for 39m, current state active+undersized+degraded, last acting [1,5]
    pg 2.7d is stuck undersized for 39m, current state active+undersized+degraded, last acting [0,4]
    pg 2.7e is stuck undersized for 39m, current state active+undersized+degraded, last acting [0,4]
    pg 2.7f is stuck undersized for 39m, current state active+undersized+degraded, last acting [4,1]
root@proxmoxa:~#
PG_DEGRADED: Degraded data redundancy
たくさん出ているやつについて調査
まずは PG_DEGRADED を確認・・・
osdがdownしているわけではないので、参考にならなそう
とりあえず関連しそうな状態を確認
root@proxmoxa:~# ceph -s
  cluster:
    id:     26b59237-5bed-45fe-906e-aa3b13033b86
    health: HEALTH_WARN
            Degraded data redundancy: 803/2415 objects degraded (33.251%), 128 pgs degraded, 128 pgs undersized

  services:
    mon: 2 daemons, quorum proxmoxa,proxmoxb (age 89m)
    mgr: proxmoxa(active, since 96m), standbys: proxmoxb
    osd: 6 osds: 6 up (since 90m), 6 in (since 91m); 1 remapped pgs

  data:
    pools:   2 pools, 129 pgs
    objects: 805 objects, 3.1 GiB
    usage:   6.4 GiB used, 90 GiB / 96 GiB avail
    pgs:     803/2415 objects degraded (33.251%)
             2/2415 objects misplaced (0.083%)
             128 active+undersized+degraded
             1   active+clean+remapped

  io:
    client:   20 KiB/s rd, 13 MiB/s wr, 15 op/s rd, 29 op/s wr

root@proxmoxa:~#
root@proxmoxa:~# ceph osd pool stats
pool .mgr id 1
  2/6 objects misplaced (33.333%)

pool cephpool id 2
  826/2478 objects degraded (33.333%)
  client io 14 KiB/s rd, 8.4 MiB/s wr, 14 op/s rd, 15 op/s wr

root@proxmoxa:~#
root@proxmoxa:~# ceph osd pool ls detail
pool 1 '.mgr' replicated size 3 min_size 2 crush_rule 0 object_hash rjenkins pg_num 1 pgp_num 1 autoscale_mode on last_change 18 flags hashpspool stripe_width 0 pg_num_max 32 pg_num_min 1 application mgr read_balance_score 6.06
pool 2 'cephpool' replicated size 3 min_size 2 crush_rule 0 object_hash rjenkins pg_num 128 pgp_num 128 autoscale_mode on last_change 39 flags hashpspool,selfmanaged_snaps stripe_width 0 target_size_bytes 21474836480 application rbd read_balance_score 1.41
        removed_snaps_queue [2~1]

root@proxmoxa:~#
現状のcephpoolは pg_num=128, pgp_num=128 で作成されている
autoscaleの設定を見てみる
root@proxmoxa:~# ceph osd pool autoscale-status
POOL        SIZE  TARGET SIZE  RATE  RAW CAPACITY   RATIO  TARGET RATIO  EFFECTIVE RATIO  BIAS  PG_NUM  NEW PG_NUM  AUTOSCALE  BULK
.mgr      452.0k                3.0        98280M  0.0000                                  1.0       1              on         False
cephpool   2234M       20480M   3.0        98280M  0.6252                                  1.0     128              on         False
root@proxmoxa:~#
「How I Built a 2-Node HA Proxmox Cluster with Ceph, Podman, and a Raspberry Pi (Yes, It Works)」にやりたいことがあるっぽい
このページでは「ceph config set osd osd_default_size 2」と「ceph config set osd osd_default_min_size 1」を実行しているが、ceph config getで確認してみると、値はない模様
root@proxmoxa:~# ceph config get osd osd_default_size
Error ENOENT: unrecognized key 'osd_default_size'
root@proxmoxa:~# ceph config get osd osd_default_min_size
Error ENOENT: unrecognized key 'osd_default_min_size'
root@proxmoxa:~#
設定出来たりしないかを念のため確認してみたが、エラーとなった
root@proxmoxa:~# ceph config set osd osd_default_size 2
Error EINVAL: unrecognized config option 'osd_default_size'
root@proxmoxa:~# ceph config set osd osd_default_min_size 1
Error EINVAL: unrecognized config option 'osd_default_min_size'
root@proxmoxa:~#
osd_pool_default_sizeとosd_pool_default_min_sizeならばあるので、そちらを設定してみることにした
root@proxmoxa:~# ceph config get osd osd_pool_default_size
3
root@proxmoxa:~# ceph config get osd osd_pool_default_min_size
0
root@proxmoxa:~#
root@proxmoxa:~# ceph config set osd osd_pool_default_size 2
root@proxmoxa:~# ceph config set osd osd_pool_default_min_size 1
root@proxmoxa:~# ceph config get osd osd_pool_default_size
2
root@proxmoxa:~# ceph config get osd osd_pool_default_min_size
1
root@proxmoxa:~#
状態に変化はなさそう
root@proxmoxa:~# ceph -s
  cluster:
    id:     26b59237-5bed-45fe-906e-aa3b13033b86
    health: HEALTH_WARN
            Degraded data redundancy: 885/2661 objects degraded (33.258%), 128 pgs degraded, 128 pgs undersized

  services:
    mon: 2 daemons, quorum proxmoxa,proxmoxb (age 2h)
    mgr: proxmoxa(active, since 2h), standbys: proxmoxb
    osd: 6 osds: 6 up (since 2h), 6 in (since 2h); 1 remapped pgs

  data:
    pools:   2 pools, 129 pgs
    objects: 887 objects, 3.4 GiB
    usage:   7.1 GiB used, 89 GiB / 96 GiB avail
    pgs:     885/2661 objects degraded (33.258%)
             2/2661 objects misplaced (0.075%)
             128 active+undersized+degraded
             1   active+clean+remapped

root@proxmoxa:~# ceph osd pool autoscale-status
POOL        SIZE  TARGET SIZE  RATE  RAW CAPACITY   RATIO  TARGET RATIO  EFFECTIVE RATIO  BIAS  PG_NUM  NEW PG_NUM  AUTOSCALE  BULK
.mgr      452.0k                3.0        98280M  0.0000                                  1.0       1              on         False
cephpool   2319M       20480M   3.0        98280M  0.6252                                  1.0     128              on         False
root@proxmoxa:~# ceph osd pool stats
pool .mgr id 1
  2/6 objects misplaced (33.333%)

pool cephpool id 2
  885/2655 objects degraded (33.333%)
  client io 170 B/s wr, 0 op/s rd, 0 op/s wr

root@proxmoxa:~# ceph osd pool ls detail
pool 1 '.mgr' replicated size 3 min_size 2 crush_rule 0 object_hash rjenkins pg_num 1 pgp_num 1 autoscale_mode on last_change 18 flags hashpspool stripe_width 0 pg_num_max 32 pg_num_min 1 application mgr read_balance_score 6.06
pool 2 'cephpool' replicated size 3 min_size 2 crush_rule 0 object_hash rjenkins pg_num 128 pgp_num 128 autoscale_mode on last_change 39 flags hashpspool,selfmanaged_snaps stripe_width 0 target_size_bytes 21474836480 application rbd read_balance_score 1.41
        removed_snaps_queue [2~1]

root@proxmoxa:~#
ceph osd pool get コマンドで、各プールのsizeとmin_sizeを確認
root@proxmoxa:~# ceph osd pool get cephpool size
size: 3
root@proxmoxa:~# ceph osd pool get cephpool min_size
min_size: 2
root@proxmoxa:~#
設定を変更
root@proxmoxa:~# ceph osd pool set cephpool size 2
set pool 2 size to 2
root@proxmoxa:~# ceph osd pool set cephpool min_size 1
set pool 2 min_size to 1
root@proxmoxa:~# ceph osd pool get cephpool size
size: 2
root@proxmoxa:~# ceph osd pool get cephpool min_size
min_size: 1
root@proxmoxa:~#
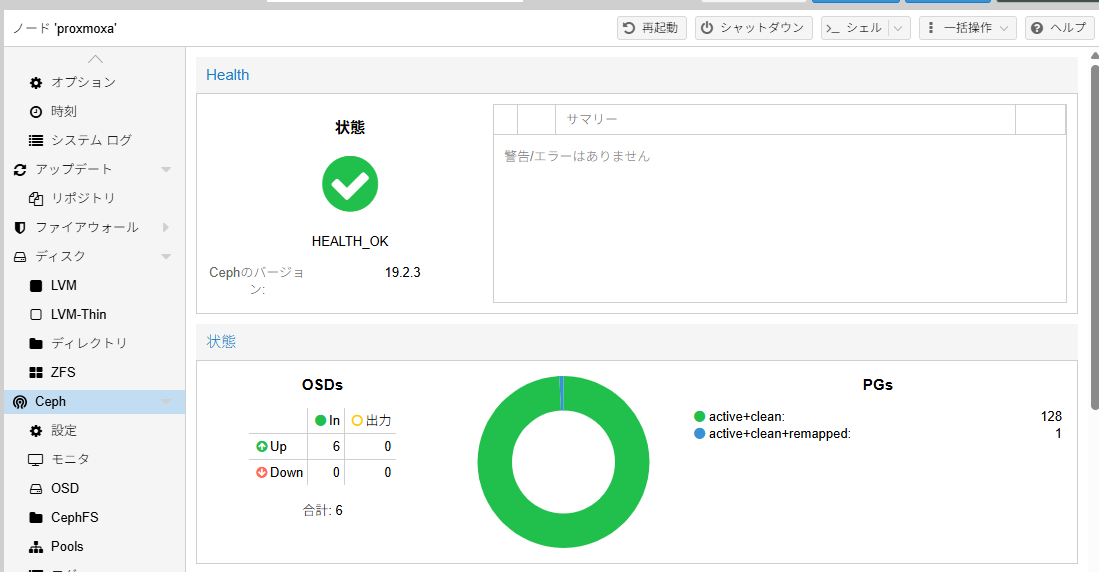
状態確認すると、ceph health がHEALTH_OKになっている
root@proxmoxa:~# ceph health
HEALTH_OK
root@proxmoxa:~# ceph health detail
HEALTH_OK
root@proxmoxa:~#
他のステータスは?と確認してみると、問題無く見える
root@proxmoxa:~# ceph -s
  cluster:
    id:     26b59237-5bed-45fe-906e-aa3b13033b86
    health: HEALTH_OK

  services:
    mon: 2 daemons, quorum proxmoxa,proxmoxb (age 2h)
    mgr: proxmoxa(active, since 2h), standbys: proxmoxb
    osd: 6 osds: 6 up (since 2h), 6 in (since 2h); 1 remapped pgs

  data:
    pools:   2 pools, 129 pgs
    objects: 887 objects, 3.4 GiB
    usage:   7.1 GiB used, 89 GiB / 96 GiB avail
    pgs:     2/1776 objects misplaced (0.113%)
             128 active+clean
             1   active+clean+remapped

  io:
    recovery: 1.3 MiB/s, 0 objects/s

root@proxmoxa:~# ceph osd pool autoscale-status
POOL        SIZE  TARGET SIZE  RATE  RAW CAPACITY   RATIO  TARGET RATIO  EFFECTIVE RATIO  BIAS  PG_NUM  NEW PG_NUM  AUTOSCALE  BULK
.mgr      452.0k                3.0        98280M  0.0000                                  1.0       1              on         False
cephpool   3479M       20480M   2.0        98280M  0.4168                                  1.0     128              on         False
root@proxmoxa:~# ceph osd pool stats
pool .mgr id 1
  2/6 objects misplaced (33.333%)

pool cephpool id 2
  nothing is going on

root@proxmoxa:~# ceph osd pool ls detail
pool 1 '.mgr' replicated size 3 min_size 2 crush_rule 0 object_hash rjenkins pg_num 1 pgp_num 1 autoscale_mode on last_change 18 flags hashpspool stripe_width 0 pg_num_max 32 pg_num_min 1 application mgr read_balance_score 6.06
pool 2 'cephpool' replicated size 2 min_size 1 crush_rule 0 object_hash rjenkins pg_num 128 pgp_num 128 autoscale_mode on last_change 42 flags hashpspool,selfmanaged_snaps stripe_width 0 target_size_bytes 21474836480 application rbd read_balance_score 1.17

root@proxmoxa:~#
GUIもHEALTH_OK
障害テスト
片側を停止してどうなるか?
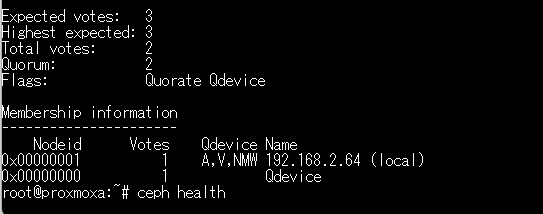
PVEのクラスタ側は生きている
root@proxmoxa:~# ha-manager status
quorum OK
master proxmoxa (active, Wed Jan 21 17:43:39 2026)
lrm proxmoxa (active, Wed Jan 21 17:43:40 2026)
lrm proxmoxb (old timestamp - dead?, Wed Jan 21 17:43:08 2026)
service vm:100 (proxmoxa, started)
root@proxmoxa:~# pvecm status
Cluster information
-------------------
Name:             cephcluster
Config Version:   3
Transport:        knet
Secure auth:      on

Quorum information
------------------
Date:             Wed Jan 21 17:44:11 2026
Quorum provider:  corosync_votequorum
Nodes:            1
Node ID:          0x00000001
Ring ID:          1.3b
Quorate:          Yes

Votequorum information
----------------------
Expected votes:   3
Highest expected: 3
Total votes:      2
Quorum:           2
Flags:            Quorate Qdevice

Membership information
----------------------
    Nodeid      Votes    Qdevice Name
0x00000001          1    A,V,NMW 192.168.2.64 (local)
0x00000000          1            Qdevice
root@proxmoxa:~#
しかし、cephのステータスは死んでいる
「ceph helth」コマンドを実行してみると返事が返ってこない
root@proxmoxa:~# ceph health
ダメそうなので、停止したノードを復帰
ceph osd poolの.mgrについてもsizeとmin_sizeを変更
root@proxmoxa:~# ceph osd pool ls
.mgr
cephpool
root@proxmoxa:~# ceph osd pool get .mgr size
size: 3
root@proxmoxa:~# ceph osd pool get .mgr min_size
min_size: 2
root@proxmoxa:~# ceph osd pool set .mgr size 2
set pool 1 size to 2
root@proxmoxa:~# ceph osd pool set .mgr min_size 1
set pool 1 min_size to 1
root@proxmoxa:~# ceph osd pool get .mgr size
size: 2
root@proxmoxa:~# ceph osd pool get .mgr min_size
min_size: 1
root@proxmoxa:~#
で、先のブログにあるようにmonパラメータも変更するため、現在値を確認
root@proxmoxa:~# ceph config get mon mon_osd_min_down_reporters
2
root@proxmoxa:~# ceph config get mon mon_osd_down_out_interval
600
root@proxmoxa:~# ceph config get mon mon_osd_report_timeout
900
root@proxmoxa:~#
これをそれぞれ変更
root@proxmoxa:~# ceph config set mon mon_osd_min_down_reporters 1
root@proxmoxa:~# ceph config set mon mon_osd_down_out_interval 120
root@proxmoxa:~# ceph config set mon mon_osd_report_timeout 90
root@proxmoxa:~# ceph config get mon mon_osd_min_down_reporters
1
root@proxmoxa:~# ceph config get mon mon_osd_down_out_interval
120
root@proxmoxa:~# ceph config get mon mon_osd_report_timeout
90
root@proxmoxa:~#
・・・相変わらずceph -sで応答がなくなる
cephを維持するための3番目のノードをどう作成する?
先ほどの記事の「Faking a Third Node with a Containerized MON」にコンテナとして3つめのceph monを起動させる話が書いてあった
Proxmox VEフォーラムの「3rd Ceph MON on external QDevice (Podman) – 4-node / 2-site cluster」からProxmox VE wikiの「Stretch Cluster」ではceph monではなく「tie-breaker node」を立てるとある
またStretch Clusterでは、先ほど変更したOSDのsize=4, min_size=2 として、2つのノードに2個のレプリカを保証する設定としていた。
とりあえず、OSDのsize/min_sizeを変更する
root@proxmoxa:~# ceph osd pool ls
.mgr
cephpool
root@proxmoxa:~# ceph osd pool get .mgr size
size: 2
root@proxmoxa:~# ceph osd pool get .mgr min_size
min_size: 1
root@proxmoxa:~# ceph osd pool set .mgr size 4
set pool 1 size to 4
root@proxmoxa:~# ceph osd pool set .mgr min_size 2
set pool 1 min_size to 2
root@proxmoxa:~# ceph osd pool get .mgr size
size: 4
root@proxmoxa:~# ceph osd pool get .mgr min_size
min_size: 2
root@proxmoxa:~# ceph osd pool get cephpool size
size: 2
root@proxmoxa:~# ceph osd pool get cephpool min_size
min_size: 1
root@proxmoxa:~# ceph osd pool set cephpool size 4
set pool 2 size to 4
root@proxmoxa:~# ceph osd pool set cephpool min_size 2
set pool 2 min_size to 2
root@proxmoxa:~# ceph osd pool get cephpool size
size: 4
root@proxmoxa:~# ceph osd pool get cephpool min_size
min_size: 2
root@proxmoxa:~#
この状態でceph osd pool statsを取ると先ほどまで33.333%だったものが50.0% なった
root@proxmoxa:~# ceph osd pool stats
pool .mgr id 1
  4/8 objects degraded (50.000%)

pool cephpool id 2
  1770/3540 objects degraded (50.000%)

root@proxmoxa:~# ceph -s
  cluster:
    id:     26b59237-5bed-45fe-906e-aa3b13033b86
    health: HEALTH_WARN
            Degraded data redundancy: 1774/3548 objects degraded (50.000%), 129 pgs degraded, 129 pgs undersized

  services:
    mon: 2 daemons, quorum proxmoxa,proxmoxb (age 6h)
    mgr: proxmoxb(active, since 6h), standbys: proxmoxa
    osd: 6 osds: 6 up (since 6h), 6 in (since 24h)

  data:
    pools:   2 pools, 129 pgs
    objects: 887 objects, 3.4 GiB
    usage:   7.0 GiB used, 89 GiB / 96 GiB avail
    pgs:     1774/3548 objects degraded (50.000%)
             129 active+undersized+degraded

root@proxmoxa:~#
root@proxmoxa:~# ceph health
HEALTH_WARN Degraded data redundancy: 1774/3548 objects degraded (50.000%), 129 pgs degraded, 129 pgs undersized
root@proxmoxa:~# ceph health detail
HEALTH_WARN Degraded data redundancy: 1774/3548 objects degraded (50.000%), 129 pgs degraded, 129 pgs undersized
[WRN] PG_DEGRADED: Degraded data redundancy: 1774/3548 objects degraded (50.000%), 129 pgs degraded, 129 pgs undersized
    pg 1.0 is stuck undersized for 5m, current state active+undersized+degraded, last acting [3,0]
    pg 2.0 is stuck undersized for 5m, current state active+undersized+degraded, last acting [3,1]
    pg 2.1 is stuck undersized for 5m, current state active+undersized+degraded, last acting [2,5]
    pg 2.2 is stuck undersized for 5m, current state active+undersized+degraded, last acting [5,1]
    pg 2.3 is stuck undersized for 5m, current state active+undersized+degraded, last acting [5,2]
    pg 2.4 is stuck undersized for 5m, current state active+undersized+degraded, last acting [1,4]
    pg 2.5 is stuck undersized for 5m, current state active+undersized+degraded, last acting [4,0]
    pg 2.6 is stuck undersized for 5m, current state active+undersized+degraded, last acting [1,3]
    pg 2.7 is stuck undersized for 5m, current state active+undersized+degraded, last acting [3,2]
    pg 2.8 is stuck undersized for 5m, current state active+undersized+degraded, last acting [3,0]
    pg 2.9 is stuck undersized for 5m, current state active+undersized+degraded, last acting [1,4]
    pg 2.a is stuck undersized for 5m, current state active+undersized+degraded, last acting [1,4]
    pg 2.b is stuck undersized for 5m, current state active+undersized+degraded, last acting [3,0]
    pg 2.c is stuck undersized for 5m, current state active+undersized+degraded, last acting [2,3]
    pg 2.d is stuck undersized for 5m, current state active+undersized+degraded, last acting [2,3]
    pg 2.e is stuck undersized for 5m, current state active+undersized+degraded, last acting [2,3]
    pg 2.f is stuck undersized for 5m, current state active+undersized+degraded, last acting [4,0]
    pg 2.10 is active+undersized+degraded, acting [2,4]
    pg 2.1c is stuck undersized for 5m, current state active+undersized+degraded, last acting [4,2]
    pg 2.1d is stuck undersized for 5m, current state active+undersized+degraded, last acting [3,0]
    pg 2.1e is stuck undersized for 5m, current state active+undersized+degraded, last acting [2,5]
    pg 2.1f is stuck undersized for 5m, current state active+undersized+degraded, last acting [0,3]
    pg 2.20 is stuck undersized for 5m, current state active+undersized+degraded, last acting [5,1]
    pg 2.21 is stuck undersized for 5m, current state active+undersized+degraded, last acting [2,4]
    pg 2.22 is stuck undersized for 5m, current state active+undersized+degraded, last acting [3,2]
    pg 2.23 is stuck undersized for 5m, current state active+undersized+degraded, last acting [0,3]
    pg 2.24 is stuck undersized for 5m, current state active+undersized+degraded, last acting [5,1]
    pg 2.25 is stuck undersized for 5m, current state active+undersized+degraded, last acting [4,2]
    pg 2.26 is stuck undersized for 5m, current state active+undersized+degraded, last acting [5,2]
    pg 2.27 is stuck undersized for 5m, current state active+undersized+degraded, last acting [3,0]
    pg 2.28 is stuck undersized for 5m, current state active+undersized+degraded, last acting [2,3]
    pg 2.29 is stuck undersized for 5m, current state active+undersized+degraded, last acting [3,1]
    pg 2.2a is stuck undersized for 5m, current state active+undersized+degraded, last acting [5,0]
    pg 2.2b is stuck undersized for 5m, current state active+undersized+degraded, last acting [2,4]
    pg 2.2c is stuck undersized for 5m, current state active+undersized+degraded, last acting [2,5]
    pg 2.2d is stuck undersized for 5m, current state active+undersized+degraded, last acting [5,2]
    pg 2.2e is stuck undersized for 5m, current state active+undersized+degraded, last acting [5,0]
    pg 2.2f is stuck undersized for 5m, current state active+undersized+degraded, last acting [5,0]
    pg 2.30 is stuck undersized for 5m, current state active+undersized+degraded, last acting [4,0]
    pg 2.31 is stuck undersized for 5m, current state active+undersized+degraded, last acting [0,5]
    pg 2.32 is stuck undersized for 5m, current state active+undersized+degraded, last acting [5,1]
    pg 2.33 is stuck undersized for 5m, current state active+undersized+degraded, last acting [3,1]
    pg 2.34 is stuck undersized for 5m, current state active+undersized+degraded, last acting [5,0]
    pg 2.35 is stuck undersized for 5m, current state active+undersized+degraded, last acting [1,3]
    pg 2.36 is stuck undersized for 5m, current state active+undersized+degraded, last acting [1,4]
    pg 2.37 is stuck undersized for 5m, current state active+undersized+degraded, last acting [3,1]
    pg 2.38 is stuck undersized for 5m, current state active+undersized+degraded, last acting [0,5]
    pg 2.39 is stuck undersized for 5m, current state active+undersized+degraded, last acting [1,5]
    pg 2.7d is stuck undersized for 5m, current state active+undersized+degraded, last acting [0,4]
    pg 2.7e is stuck undersized for 5m, current state active+undersized+degraded, last acting [0,4]
    pg 2.7f is stuck undersized for 5m, current state active+undersized+degraded, last acting [4,1]
root@proxmoxa:~#
このときのceph osd treeは下記の状態
root@proxmoxa:~# ceph osd tree
ID  CLASS  WEIGHT   TYPE NAME          STATUS  REWEIGHT  PRI-AFF
-1         0.09357  root default
-5         0.04678      host proxmoxa
 3    ssd  0.01559          osd.3          up   1.00000  1.00000
 4    ssd  0.01559          osd.4          up   1.00000  1.00000
 5    ssd  0.01559          osd.5          up   1.00000  1.00000
-3         0.04678      host proxmoxb
 0    ssd  0.01559          osd.0          up   1.00000  1.00000
 1    ssd  0.01559          osd.1          up   1.00000  1.00000
 2    ssd  0.01559          osd.2          up   1.00000  1.00000
root@proxmoxa:~#
次にCRUSH Structureを2個作る
root@proxmoxa:~# ceph osd crush add-bucket room1 room
added bucket room1 type room to crush map
root@proxmoxa:~# ceph osd crush add-bucket room2 room
added bucket room2 type room to crush map
root@proxmoxa:~# ceph osd tree
ID  CLASS  WEIGHT   TYPE NAME          STATUS  REWEIGHT  PRI-AFF
-8               0  room room2
-7               0  room room1
-1         0.09357  root default
-5         0.04678      host proxmoxa
 3    ssd  0.01559          osd.3          up   1.00000  1.00000
 4    ssd  0.01559          osd.4          up   1.00000  1.00000
 5    ssd  0.01559          osd.5          up   1.00000  1.00000
-3         0.04678      host proxmoxb
 0    ssd  0.01559          osd.0          up   1.00000  1.00000
 1    ssd  0.01559          osd.1          up   1.00000  1.00000
 2    ssd  0.01559          osd.2          up   1.00000  1.00000
root@proxmoxa:~#
で、移動?
root@proxmoxa:~# ceph osd crush move room1 root=default
moved item id -7 name 'room1' to location {root=default} in crush map
root@proxmoxa:~# ceph osd crush move room2 root=default
moved item id -8 name 'room2' to location {root=default} in crush map
root@proxmoxa:~# ceph osd tree
ID  CLASS  WEIGHT   TYPE NAME          STATUS  REWEIGHT  PRI-AFF
-1         0.09357  root default
-5         0.04678      host proxmoxa
 3    ssd  0.01559          osd.3          up   1.00000  1.00000
 4    ssd  0.01559          osd.4          up   1.00000  1.00000
 5    ssd  0.01559          osd.5          up   1.00000  1.00000
-3         0.04678      host proxmoxb
 0    ssd  0.01559          osd.0          up   1.00000  1.00000
 1    ssd  0.01559          osd.1          up   1.00000  1.00000
 2    ssd  0.01559          osd.2          up   1.00000  1.00000
-7               0      room room1
-8               0      room room2
root@proxmoxa:~#
次にノードをそれぞれ別のroomに移動
root@proxmoxa:~# ceph osd crush move proxmoxa room=room1
moved item id -5 name 'proxmoxa' to location {room=room1} in crush map
root@proxmoxa:~# ceph osd crush move proxmoxb room=room2
moved item id -3 name 'proxmoxb' to location {room=room2} in crush map
root@proxmoxa:~# ceph osd tree
ID  CLASS  WEIGHT   TYPE NAME              STATUS  REWEIGHT  PRI-AFF
-1         0.09357  root default
-7         0.04678      room room1
-5         0.04678          host proxmoxa
 3    ssd  0.01559              osd.3          up   1.00000  1.00000
 4    ssd  0.01559              osd.4          up   1.00000  1.00000
 5    ssd  0.01559              osd.5          up   1.00000  1.00000
-8         0.04678      room room2
-3         0.04678          host proxmoxb
 0    ssd  0.01559              osd.0          up   1.00000  1.00000
 1    ssd  0.01559              osd.1          up   1.00000  1.00000
 2    ssd  0.01559              osd.2          up   1.00000  1.00000
root@proxmoxa:~#
CRUSH ruleを作成
root@proxmoxa:~# ceph osd getcrushmap > crush.map.bin
25
root@proxmoxa:~# ls -l crush.map.bin
-rw-r--r-- 1 root root 1104 Jan 22 16:31 crush.map.bin
root@proxmoxa:~# crushtool -d crush.map.bin -o crush.map.txt
root@proxmoxa:~# ls -l crush.map*
-rw-r--r-- 1 root root 1104 Jan 22 16:31 crush.map.bin
-rw-r--r-- 1 root root 1779 Jan 22 16:31 crush.map.txt
root@proxmoxa:~#
crush.map.bin はバイナリファイルなので、crushtoolでテキストにしたものを作成
現状の内容は下記だった
root@proxmoxa:~# cat crush.map.txt
# begin crush map
tunable choose_local_tries 0
tunable choose_local_fallback_tries 0
tunable choose_total_tries 50
tunable chooseleaf_descend_once 1
tunable chooseleaf_vary_r 1
tunable chooseleaf_stable 1
tunable straw_calc_version 1
tunable allowed_bucket_algs 54

# devices
device 0 osd.0 class ssd
device 1 osd.1 class ssd
device 2 osd.2 class ssd
device 3 osd.3 class ssd
device 4 osd.4 class ssd
device 5 osd.5 class ssd

# types
type 0 osd
type 1 host
type 2 chassis
type 3 rack
type 4 row
type 5 pdu
type 6 pod
type 7 room
type 8 datacenter
type 9 zone
type 10 region
type 11 root

# buckets
host proxmoxa {
        id -5           # do not change unnecessarily
        id -6 class ssd         # do not change unnecessarily
        # weight 0.04678
        alg straw2
        hash 0  # rjenkins1
        item osd.3 weight 0.01559
        item osd.4 weight 0.01559
        item osd.5 weight 0.01559
}
room room1 {
        id -7           # do not change unnecessarily
        id -10 class ssd                # do not change unnecessarily
        # weight 0.04678
        alg straw2
        hash 0  # rjenkins1
        item proxmoxa weight 0.04678
}
host proxmoxb {
        id -3           # do not change unnecessarily
        id -4 class ssd         # do not change unnecessarily
        # weight 0.04678
        alg straw2
        hash 0  # rjenkins1
        item osd.0 weight 0.01559
        item osd.1 weight 0.01559
        item osd.2 weight 0.01559
}
room room2 {
        id -8           # do not change unnecessarily
        id -9 class ssd         # do not change unnecessarily
        # weight 0.04678
        alg straw2
        hash 0  # rjenkins1
        item proxmoxb weight 0.04678
}
root default {
        id -1           # do not change unnecessarily
        id -2 class ssd         # do not change unnecessarily
        # weight 0.09357
        alg straw2
        hash 0  # rjenkins1
        item room1 weight 0.04678
        item room2 weight 0.04678
}

# rules
rule replicated_rule {
        id 0
        type replicated
        step take default
        step chooseleaf firstn 0 type host
        step emit
}

# end crush map
root@proxmoxa:~#
テキストファイルの最後に replicated_stretch_rule を追加。idは、テキストを見て他にあるruleのidの次の番号を設定する
root@proxmoxa:~# cp crush.map.txt crush-new.map.txt
root@proxmoxa:~# vi crush-new.map.txt
root@proxmoxa:~# diff -u crush.map.txt crush-new.map.txt
--- crush.map.txt       2026-01-22 16:31:44.837979276 +0900
+++ crush-new.map.txt   2026-01-22 16:35:12.146622553 +0900
@@ -87,3 +87,13 @@
 }

 # end crush map
+
+rule replicated_stretch_rule {
+        id 1
+        type replicated
+        step take default
+        step choose firstn 0 type room
+        step chooseleaf firstn 2 type host
+        step emit
+}
+
root@proxmoxa:~#
作成したファイルをcephに読み込ませる
root@proxmoxa:~# ls -l
total 12
-rw-r--r-- 1 root root 1104 Jan 22 16:31 crush.map.bin
-rw-r--r-- 1 root root 1779 Jan 22 16:31 crush.map.txt
-rw-r--r-- 1 root root 1977 Jan 22 16:35 crush-new.map.txt
root@proxmoxa:~# crushtool -c crush-new.map.txt -o crush-new.map.bin
root@proxmoxa:~# ls -l
total 16
-rw-r--r-- 1 root root 1104 Jan 22 16:31 crush.map.bin
-rw-r--r-- 1 root root 1779 Jan 22 16:31 crush.map.txt
-rw-r--r-- 1 root root 1195 Jan 22 16:36 crush-new.map.bin
-rw-r--r-- 1 root root 1977 Jan 22 16:35 crush-new.map.txt
root@proxmoxa:~# ceph osd setcrushmap -i crush-new.map.bin
26
root@proxmoxa:~#
そうするとcrush ruleが追加される
root@proxmoxa:~# ceph osd crush rule ls
replicated_rule
replicated_stretch_rule
root@proxmoxa:~#
別にosd treeは変わってない模様
root@proxmoxa:~# ceph osd tree
ID  CLASS  WEIGHT   TYPE NAME              STATUS  REWEIGHT  PRI-AFF
-1         0.09354  root default
-7         0.04677      room room1
-5         0.04677          host proxmoxa
 3    ssd  0.01558              osd.3          up   1.00000  1.00000
 4    ssd  0.01558              osd.4          up   1.00000  1.00000
 5    ssd  0.01558              osd.5          up   1.00000  1.00000
-8         0.04677      room room2
-3         0.04677          host proxmoxb
 0    ssd  0.01558              osd.0          up   1.00000  1.00000
 1    ssd  0.01558              osd.1          up   1.00000  1.00000
 2    ssd  0.01558              osd.2          up   1.00000  1.00000
root@proxmoxa:~#
root@proxmoxa:~# ceph health
HEALTH_WARN Degraded data redundancy: 448/3548 objects degraded (12.627%), 32 pgs degraded, 91 pgs undersized
root@proxmoxa:~# ceph -s
  cluster:
    id:     26b59237-5bed-45fe-906e-aa3b13033b86
    health: HEALTH_WARN
            Degraded data redundancy: 448/3548 objects degraded (12.627%), 32 pgs degraded, 91 pgs undersized

  services:
    mon: 2 daemons, quorum proxmoxa,proxmoxb (age 7h)
    mgr: proxmoxb(active, since 7h), standbys: proxmoxa
    osd: 6 osds: 6 up (since 7h), 6 in (since 25h); 97 remapped pgs

  data:
    pools:   2 pools, 129 pgs
    objects: 887 objects, 3.4 GiB
    usage:   10 GiB used, 86 GiB / 96 GiB avail
    pgs:     448/3548 objects degraded (12.627%)
             1276/3548 objects misplaced (35.964%)
             59 active+undersized+remapped
             34 active+clean+remapped
             32 active+undersized+degraded
             4  active+clean

root@proxmoxa:~#
移動していかない?
以前と同じようにpgp_numを128から32に変えてみる
root@proxmoxa:~# ceph osd pool stats
pool .mgr id 1
  4/8 objects misplaced (50.000%)

pool cephpool id 2
  448/3540 objects degraded (12.655%)
  1272/3540 objects misplaced (35.932%)

root@proxmoxa:~# ceph osd pool get cephpool pgp_num
pgp_num: 128
root@proxmoxa:~# ceph osd pool set cephpool pgp_num 32
set pool 2 pgp_num to 32
root@proxmoxa:~# ceph osd pool get cephpool pgp_num
pgp_num: 128
root@proxmoxa:~#
かわっていかない・・・
root@proxmoxa:~# ceph osd pool stats
pool .mgr id 1
  4/8 objects misplaced (50.000%)

pool cephpool id 2
  448/3540 objects degraded (12.655%)
  1272/3540 objects misplaced (35.932%)
  client io 170 B/s wr, 0 op/s rd, 0 op/s wr

root@proxmoxa:~# ceph -s
  cluster:
    id:     26b59237-5bed-45fe-906e-aa3b13033b86
    health: HEALTH_WARN
            Degraded data redundancy: 448/3548 objects degraded (12.627%), 32 pgs degraded, 91 pgs undersized
            1 pools have pg_num > pgp_num

  services:
    mon: 2 daemons, quorum proxmoxa,proxmoxb (age 7h)
    mgr: proxmoxb(active, since 7h), standbys: proxmoxa
    osd: 6 osds: 6 up (since 7h), 6 in (since 25h); 97 remapped pgs

  data:
    pools:   2 pools, 129 pgs
    objects: 887 objects, 3.4 GiB
    usage:   10 GiB used, 86 GiB / 96 GiB avail
    pgs:     448/3548 objects degraded (12.627%)
             1276/3548 objects misplaced (35.964%)
             59 active+undersized+remapped
             34 active+clean+remapped
             32 active+undersized+degraded
             4  active+clean

  io:
    client:   170 B/s wr, 0 op/s rd, 0 op/s wr

root@proxmoxa:~#
「1 pools have pg_num > pgp_num」とでているなら、pg_numもかえてみるか?
root@proxmoxa:~# ceph osd pool set cephpool pg_num 32
set pool 2 pg_num to 32
root@proxmoxa:~#
root@proxmoxa:~# ceph -s
  cluster:
    id:     26b59237-5bed-45fe-906e-aa3b13033b86
    health: HEALTH_WARN
            Degraded data redundancy: 448/3548 objects degraded (12.627%), 32 pgs degraded, 91 pgs undersized

  services:
    mon: 2 daemons, quorum proxmoxa,proxmoxb (age 7h)
    mgr: proxmoxb(active, since 7h), standbys: proxmoxa
    osd: 6 osds: 6 up (since 7h), 6 in (since 25h); 97 remapped pgs

  data:
    pools:   2 pools, 129 pgs
    objects: 887 objects, 3.4 GiB
    usage:   10 GiB used, 86 GiB / 96 GiB avail
    pgs:     448/3548 objects degraded (12.627%)
             1276/3548 objects misplaced (35.964%)
             59 active+undersized+remapped
             34 active+clean+remapped
             32 active+undersized+degraded
             4  active+clean

root@proxmoxa:~#
しばらく待ったものの変化はない
crush ruleが適用されているのか?
「6.3. CRUSH ルールが作成され、プールが正しい CRUSH ルールに設定されていることの確認」
現状のルールのrule idを確認
root@proxmoxa:~# ceph osd crush rule dump | grep -E "rule_(id|name)"
        "rule_id": 0,
        "rule_name": "replicated_rule",
        "rule_id": 1,
        "rule_name": "replicated_stretch_rule",
root@proxmoxa:~#
実際のpoolに設定されているルールのIDを確認
root@proxmoxa:~# ceph osd dump|grep cephpool
pool 2 'cephpool' replicated size 4 min_size 2 crush_rule 0 object_hash rjenkins pg_num 128 pgp_num 128 autoscale_mode on last_change 133 flags hashpspool,selfmanaged_snaps stripe_width 0 target_size_bytes 21474836480 application rbd read_balance_score 1.22
root@proxmoxa:~#
「crush_rule 0」とあるので、変更されてないっぽい
既存poolにcrush ruleを適用する方法をRedHatドキュメントから
root@proxmoxa:~# ceph osd pool get cephpool crush_rule
crush_rule: replicated_rule
root@proxmoxa:~# ceph osd pool set cephpool crush_rule replicated_stretch_rule
set pool 2 crush_rule to replicated_stretch_rule
root@proxmoxa:~# ceph osd pool get cephpool crush_rule
crush_rule: replicated_stretch_rule
root@proxmoxa:~# ceph osd dump|grep cephpool
pool 2 'cephpool' replicated size 4 min_size 2 crush_rule 1 object_hash rjenkins pg_num 128 pgp_num 128 autoscale_mode on last_change 134 flags hashpspool,selfmanaged_snaps stripe_width 0 target_size_bytes 21474836480 application rbd read_balance_score 1.22
root@proxmoxa:~#
変更できた
うーん・・・・?
root@proxmoxa:~# ceph osd pool stats
pool .mgr id 1
  4/8 objects misplaced (50.000%)

pool cephpool id 2
  194/3540 objects degraded (5.480%)
  1562/3540 objects misplaced (44.124%)

root@proxmoxa:~# ceph -s
  cluster:
    id:     26b59237-5bed-45fe-906e-aa3b13033b86
    health: HEALTH_WARN
            Degraded data redundancy: 194/3548 objects degraded (5.468%), 14 pgs degraded, 83 pgs undersized

  services:
    mon: 2 daemons, quorum proxmoxa,proxmoxb (age 8h)
    mgr: proxmoxb(active, since 8h), standbys: proxmoxa
    osd: 6 osds: 6 up (since 8h), 6 in (since 26h); 115 remapped pgs

  data:
    pools:   2 pools, 129 pgs
    objects: 887 objects, 3.4 GiB
    usage:   11 GiB used, 85 GiB / 96 GiB avail
    pgs:     194/3548 objects degraded (5.468%)
             1566/3548 objects misplaced (44.138%)
             69 active+undersized+remapped
             45 active+clean+remapped
             14 active+undersized+degraded
             1  active+clean

root@proxmoxa:~# ceph osd pool stats
pool .mgr id 1
  4/8 objects misplaced (50.000%)

pool cephpool id 2
  194/3540 objects degraded (5.480%)
  1562/3540 objects misplaced (44.124%)
  client io 1.4 KiB/s wr, 0 op/s rd, 0 op/s wr

root@proxmoxa:~#
「手順: PG カウントの増加」にpg_numとpgp_numをかえる、という話があって、pgp_numを4にしてたので実行してみた
root@proxmoxa:~# ceph osd pool get cephpool pg_num
pg_num: 128
root@proxmoxa:~# ceph osd pool get cephpool pgp_num
pgp_num: 128
root@proxmoxa:~# ceph osd pool set cephpool pgp_num 4
set pool 2 pgp_num to 4
root@proxmoxa:~# ceph osd pool get cephpool pgp_num
pgp_num: 128
root@proxmoxa:~# ceph -s
  cluster:
    id:     26b59237-5bed-45fe-906e-aa3b13033b86
    health: HEALTH_WARN
            Degraded data redundancy: 194/3548 objects degraded (5.468%), 14 pgs degraded, 83 pgs undersized
            1 pools have pg_num > pgp_num

  services:
    mon: 2 daemons, quorum proxmoxa,proxmoxb (age 9h)
    mgr: proxmoxb(active, since 9h), standbys: proxmoxa
    osd: 6 osds: 6 up (since 9h), 6 in (since 27h); 115 remapped pgs

  data:
    pools:   2 pools, 129 pgs
    objects: 887 objects, 3.4 GiB
    usage:   11 GiB used, 85 GiB / 96 GiB avail
    pgs:     194/3548 objects degraded (5.468%)
             1566/3548 objects misplaced (44.138%)
             69 active+undersized+remapped
             45 active+clean+remapped
             14 active+undersized+degraded
             1  active+clean

root@proxmoxa:~#
「1 pools have pg_num > pgp_num」という出力がでるようになってしまった
じゃあ、pg_num も4にしてみる
root@proxmoxa:~# ceph osd pool set cephpool pg_num 4
set pool 2 pg_num to 4
root@proxmoxa:~# ceph osd pool get cephpool pg_num
pg_num: 128
root@proxmoxa:~# ceph -s
  cluster:
    id:     26b59237-5bed-45fe-906e-aa3b13033b86
    health: HEALTH_WARN
            Degraded data redundancy: 194/3548 objects degraded (5.468%), 14 pgs degraded, 83 pgs undersized

  services:
    mon: 2 daemons, quorum proxmoxa,proxmoxb (age 9h)
    mgr: proxmoxb(active, since 9h), standbys: proxmoxa
    osd: 6 osds: 6 up (since 9h), 6 in (since 27h); 115 remapped pgs

  data:
    pools:   2 pools, 129 pgs
    objects: 887 objects, 3.4 GiB
    usage:   11 GiB used, 85 GiB / 96 GiB avail
    pgs:     194/3548 objects degraded (5.468%)
             1566/3548 objects misplaced (44.138%)
             69 active+undersized+remapped
             45 active+clean+remapped
             14 active+undersized+degraded
             1  active+clean

root@proxmoxa:~#
関係なさそう